Key Takeaways
Stark racial inequity has long been a deeply troubling aspect of our criminal justice system. In recent years, traffic stops have emerged as a key factor driving some of these inequities and an area of potential reform. Are there opportunities to identify kinds of traffic stops that could be enforced in alternative ways—potentially improving officer and civilian safety, enhancing police efficiency, and reducing racial disparities—without jeopardizing road safety?
To explore this question, in this report we use data on 3.4 million traffic stops made in 2019 by California’s 15 largest law enforcement agencies to examine racial disparities in stop outcomes and experiences across time of the day, type of law enforcement agency, and type of traffic violation.
- Traffic stops peak during commuting hours, but roughly 20 percent of stops in an average day take place between 9 p.m. and 3 a.m. During this time, more than half of traffic stops made by local police and sheriff departments are for non-moving violations, such as lack of registration or improper display of a license plate. →
- Traffic stops lead to some confiscated firearms, and such confiscations are important to public safety. In 2019, law enforcement officers, mostly local police officers, confiscated firearms in 905 traffic stops. Of these stops, 421 (47%) took place in the hours between 9 p.m. and 3 a.m., and 462 (51%) were for non-moving violations. →
- Racial disparities are particularly notable in stops by police departments, where Black drivers make up about a third of traffic stops in the hours around midnight, roughly twice the share of white drivers. Local law enforcement officers are especially likely to search Black and Latino drivers during nighttime stops, but discovery rates for contraband or evidence are lower than those of white drivers. →
- A not-insignificant proportion of traffic stops lead to no enforcement or discovery—suggesting that gains in efficiency are possible. Officers spent a total of 80,000 hours in 2019 on 211,000 traffic stops that did not lead to any enforcement or discovery of contraband or evidence. These stops represent 6 percent of all traffic stops and 7 percent of total officer hours spent on traffic stops. For local law enforcement agencies, almost one in three stops of Black drivers in the hours before and after midnight result in no enforcement or discovery. →
- Improving no-enforcement/no-discovery stops may also lead to gains in equity. Most stops (76%) with no enforcement and no discovery are limited to verbal communication, but thousands involve intrusive actions—such as being searched (37,400 stops), detained (35,700), or handcuffed (15,000). Black and Latino drivers are overrepresented in stops involving intrusive actions. →
- While difficult to pinpoint, traffic stop data suggest that racial bias may be a contributing factor to disparities in traffic stops for Black and Latino drivers. Our “veil of darkness” analysis of the likelihood of being stopped for a traffic violation indicates that the ability to identify drivers’ race/ethnicity may play a role in officers’ stopping decisions. →
These findings suggest that nighttime traffic stops for non-moving violations—especially those made by police and sheriff departments—deserve consideration for alternative enforcement strategies. However, any changes need to be balanced against the possibility of hampering efforts to confiscate dangerous contraband, especially firearms. Evidence-based practices to reduce racial bias, such as diversifying policing staff, could also help mitigate inequities and improve public safety.
Introduction
In 2020, the killing of George Floyd by a Minneapolis police officer—and the deaths of other African Americans in police custody—sparked widespread protests and intensified concerns about persistent racial inequities in the criminal justice system. In recent PPIC surveys, 61 percent of California adults believe that the criminal justice system is biased against Black individuals, with 84 percent of Black Californians holding this view (Baldassare et al. 2022). And while 54 percent of California adults say police treat all racial and ethnic minorities fairly “almost always” or “most of the time,” only 18 percent of Black Californians share this opinion (Lawler and Thomas 2021).
Efforts to reduce racial inequities in people’s experiences with police are critical to improving community engagement and trust in law enforcement. To begin answering questions about the size of these racial disparities, the contexts in which they occur, and the groups of people being affected, California passed the Racial and Identity Profiling Act (RIPA) in 2015. Implementation has been rolled out in waves based on the size of the agency. Since 2018, the state’s largest law enforcement agencies have been collecting officer-perceived data on demographics and other details for all pedestrian and traffic stops, and reporting this information to the California Department of Justice, with more agencies required to report each year. By 2023, all law enforcement agencies in California will be required to collect and submit stop data.
This rich data source has already yielded important insights into racial disparities in police stops and encounters. Recent research finds that Black Californians are more than twice as likely to be searched as white Californians, but searches of Black Californians are somewhat less likely to yield contraband or evidence. While differences in jurisdiction and context significantly contribute to racial disparities in experiences with law enforcement officers, notable inequities remain even after accounting for such factors (Lofstrom et al. 2021). This research also identifies that disparities—especially between Black and white individuals—are greatest in traffic stops made by local law enforcement (i.e., police and sheriff departments, as opposed to the California Highway Patrol).
Interactions between civilians and police, whether for a traffic stop or another reason, carry inherent risks. In 2019, 799 assaults on police officers occurred during traffic pursuits and stops in California (7.6% of total assaults on law enforcement)—55 of which involved a firearm (19% of all firearm-related assaults on law enforcement). In addition, in a study of police use of force, Premkumar et al. (2021) finds that traffic and pedestrian stops account for about 15 percent of police encounters in which a civilian is seriously injured or killed. Overall, there are stark racial disparities in civilians injured during law enforcement encounters. Black Californians are about three times more likely to be seriously injured, shot, or killed by the police relative to their share of the state’s population. Concerns about these racial disparities in use of force have motivated several statewide policing reforms. In addition, a few cities in California, including Los Angeles, San Francisco and Berkeley, have proposed reforming enforcement of some traffic violations.
In this report, we build on our previous work by using RIPA data to help identify traffic stops that may deserve consideration for alternative enforcement practices. Traffic stops that could be enforced using alternative methods would be those that are unlikely to jeopardize public or road safety but that could: (1) improve safety for officers and civilians, (2) increase police efficiency, and (3) reduce racial disparities.
Since agencies have substantial differences in their primary missions, objectives, and jurisdictions, we examine stop outcomes by type of law enforcement agency (the California Highway Patrol or local law enforcement; the latter can be further separated into police and sheriff departments). Furthermore, we analyze traffic stops for both moving violations (e.g., speeding or failure to stop) and non-moving violations (e.g., improper display of a license plate, expired registration tag, or failure to maintain vehicle light equipment). Non-moving violations in particular may be an area where alternative enforcement—such as mailing the vehicle owner a “fix-it ticket” and/or citation, as proposed by San Francisco Police Chief Bill Scott—is feasible and safe.
Traffic stops that do not lead to any enforcement or discovery of contraband or evidence deserve special attention—while these incidents are a small minority of all stops, they fall disproportionately on people of color and may not be an efficient use of law enforcement officers’ time (Lofstrom et al. 2021). The “intrusiveness” of these stops, as measured by outcomes such as whether individuals were asked to step out of the vehicle, searched, detained, or handcuffed, and whether an officer aimed or used a weapon, is another critical factor that could affect the relationship between community members and law enforcement. Importantly, we also examine the extent to which stop outcomes and racial disparities vary throughout the day. Such information can be used to determine when changes in policing practices may be warranted and could help guide potential changes. If, for example, searches during certain times of the day are particularly unlikely to yield contraband or evidence, this may present an opportunity to redirect such efforts and resources to other policing tasks.
One key question is whether racial disparities in traffic stops are the result of bias or targeting on the part of law enforcement. While disparities could be driven by racial bias, other factors may also play a role. For example, vehicle condition as well as driving patterns and behavior may differ across race/ethnicity and could lead to disparities in the likelihood of being stopped for a traffic violation. To examine the potential role of racial bias in traffic stops, we employ the “veil of darkness” theory, which posits that it is more difficult for officers to ascertain a person’s race or ethnicity during dark hours. If officers are racially profiling drivers, the share of people of color in traffic stops would be lower during dark hours, compared to light hours, holding everything else constant. Using the shift to and from Daylight Saving Time, we examine if people of color are more or less likely to be stopped for a traffic violation when, for a given time of the day, sudden changes in light conditions make it easier or harder, respectively, to determine an individual’s race or ethnicity.
Note that the test of the “veil of darkness” theory only applies to the likelihood of being stopped for a traffic violation and cannot be applied to other stop outcomes, as once a stop has been made, the officer has determined (the perceived) race/ethnicity of the driver. Furthermore, while nighttime conditions make it more difficult to determine a driver’s race/ethnicity than during daytime, there are contexts and locations, such as where there are streetlights, when racial/ethnic identification may still be possible. Officers may also use type, make, and condition of a vehicle to infer race/ethnicity. If such factors are indeed correlated with race/ethnicity, racial profiling may also be possible during dark hours.
This report begins with an overview of the RIPA data on police stops. Using data from 2019 for the state’s 15 largest law enforcement agencies, we then examine traffic stops across different times of day by agency, type of traffic violation, and intrusiveness. Next, we focus on racial disparities in traffic stops across these same dimensions. We then investigate the potential role of racial bias in traffic stops. Finally, we conclude with additional considerations for policy and practice based on this research.
RIPA Data on Police Stops
Recognizing the need for data and research on law enforcement stops, California passed the Racial and Identity Profiling Act in 2015 (Assembly Bill 953) in an effort to directly confront concerns over racial inequities in policing. RIPA requires all law enforcement agencies in California to collect officer-perceived demographic data and other detailed data regarding all pedestrian and traffic stops by 2023. A “stop” is defined as any detention by a peace officer of a person, or any peace officer interaction with a person in which the officer conducts a search.
The data elements mandated by statute include individual-level and stop-level information. For individual-level data, officers are required to record their perception of the identity characteristics for each person stopped, including race or ethnicity. Other perceived traits included in the RIPA data are gender, approximate age, LGBT (lesbian, gay, bisexual, or transgender) status, English fluency, and disability (including behavioral health status). Officers are prohibited from asking the person stopped to self-identify these characteristics.
Stop-level elements include:
- reason for stop (including a traffic violation, reasonable suspicion, parole/probation/mandatory supervision, knowledge of outstanding arrest warrant/wanted person, and consensual encounter resulting in search)
- action taken by officer during stop (such as suspect removed from vehicle, removed from vehicle by physical contact, curbside detention, handcuffed, canine search, use of electronic device, use of chemical spray, or use of firearm)
- reason for search (probable cause, consent, search warrant, visible contraband, odor of contraband, etc.)
- contraband or evidence discovered (such as guns, drugs, drug paraphernalia, alcohol, money, or stolen property)
- resulting enforcement (including no action, warning, citation, arrest leading to cite and release, and arrest leading to a jail booking)
The data do not allow for corroborating the accuracy of the reported information, including the race and identity of the individual stopped and the specific actions taken by the officer. Nor do the data include information on the race and ethnicity of the officer.
In this report, we rely on 2019 RIPA data. While 2020 RIPA stop data are now available, 2020 was a highly unusual year due to the COVID-19 pandemic and the numerous public health challenges it presented. These challenges led to many changes and disruptions as our criminal justice systems aimed to reduce the spread of the coronavirus. It was also a year of civil unrest and racial reckoning following the killing of George Floyd. In addition, many parts of the state experienced significant swings in crime rates (Lofstrom and Martin 2022). All of these factors raise the concern that police stops reported in the 2020 RIPA data may reflect these extraordinary circumstances rather than longer-term patterns in traffic enforcement.
The 2019 RIPA data include all traffic stops (3,394,392 stops, about 85% of all 2019 stops) reported by the 15 largest law enforcement agencies in the state. This includes California Highway Patrol (CHP), eight police departments (Los Angeles, San Diego, San Francisco, Sacramento, Fresno, San Jose, Long Beach, and Oakland), and six county sheriff’s departments (Los Angeles, San Bernardino, Sacramento, San Diego, Riverside, and Orange County). Given that the analysis is limited to large law enforcement agencies, of which Oakland Police Department is the smallest with 740 sworn officers, the findings do not speak to experiences during traffic stops in the large number of small law enforcement agencies throughout the state. For more details about the data, including detailed descriptive statistics, see Technical Appendix A in Lofstrom et al. (2021).
Throughout this report, we frequently separate stop characteristics by type of law enforcement agency. The CHP occupies a unique place in this group, with its jurisdiction over the entire geography of the state and its mandate to focus on enforcing traffic laws. The nature of this mandate, and the scope of the CHP’s operations, are reflected in the sheer number of stops it makes, as well as the reasons behind these stops. Sheriff departments, with jurisdiction over their respective counties, and municipal police departments, responsible for their own incorporated cities, also enforce traffic laws but have a wider mandate to uphold public safety. The jurisdictions for sheriff and police departments vary considerably in geography, the public safety environment, and the size, density, and racial/ethnic composition of the population. In this report, we occasionally report sheriff and police departments’ results separately when doing so helps illustrate the differences between their operations; other times, we combine these categories under the term “local” law enforcement agencies to draw a contrast with findings from the CHP.
Traffic Stop Outcomes throughout the Day
We begin our analysis of the nearly 3.4 million traffic stops made in 2019 by these 15 large law enforcement agencies (LEAs) by examining how traffic patterns affect stops and stop outcomes. Unsurprisingly, traffic stops peak during prime commuting hours, when there are the most cars on the road. As Figure 1 shows, roughly a fifth of daily stops take place between 7 a.m. and 10 a.m., and nearly another fifth occur between 3 p.m. and 6 p.m. Notably, a large number of traffic stops also take place in the hours before and after midnight: about a fifth of traffic stops in a typical day, between 80,000 and 140,000 stops per hour, take place between 9 p.m. and 3 a.m. This relatively high share of traffic stops is notable considering that there are far fewer drivers on the road during these hours.
Traffic stops peak during commuting hours, with a smaller peak in the hours around midnight
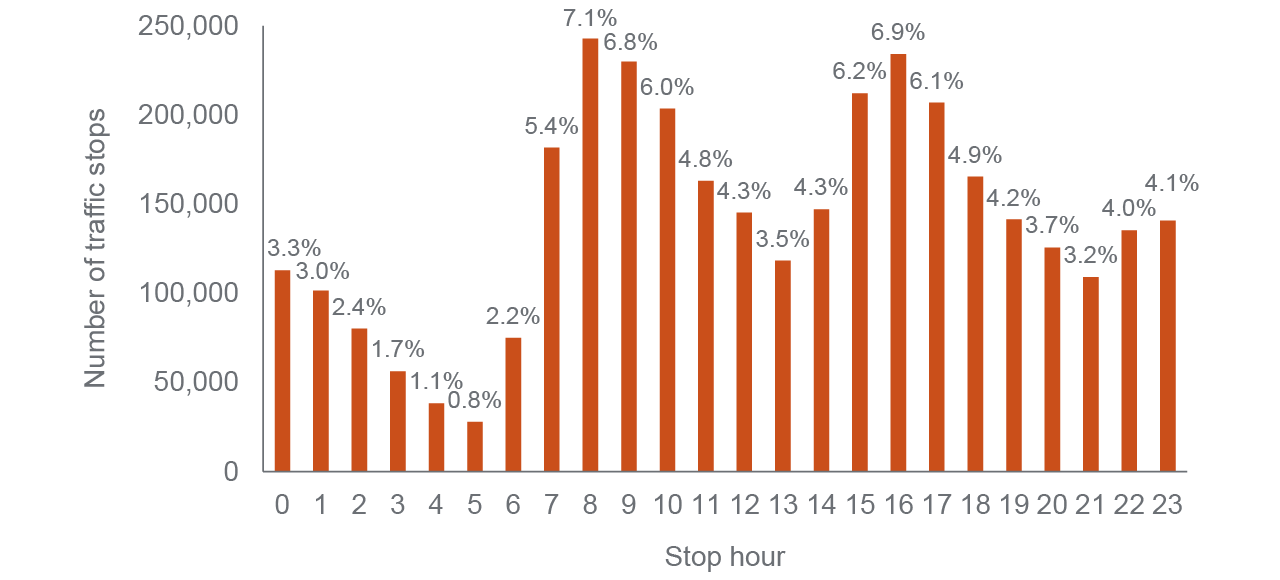
SOURCE: Author calculations using California Department of Justice, Racial and Identity Profiling Act (RIPA) Wave 2 data, 2019.
NOTE: Stop hours are shown using the 24-hour clock, sometimes referred to as “military time,” where 0 hour represents midnight.
Consistent with its organizational mission, the CHP makes many more traffic stops than police or sheriff departments. Overall, the CHP made 64 percent of the nearly 3.4 million traffic stops (almost 2.2 million), while the eight police departments made 24 percent of these stops (about 809,000) and the six sheriff departments made about 12 percent of these stops (about 425,000).
Local LEAs Are Especially Likely to Stop Drivers for Non-moving Violations at Night
Slightly more than one-third of all traffic stops are for non-moving violations. Examples of some of the most common non-moving violations are lack of registration (287,900 stops), improper display of a license plate (167,800), and failure to maintain vehicle light equipment (67,100).
Figure 2 shows the shares of stops made for non-moving violations across the day, broken down by type of law enforcement agency. Notably, in the hours before and after midnight, local law enforcement agencies are especially likely to make stops for non-moving violations. Between 9 p.m. and 3 a.m., the share of stops for non-moving violations rises to roughly half of stops made by police departments and almost two-thirds of stops made by sheriff departments, while this share drops to about a fourth of all CHP traffic stops. In contrast, during most regular work and business hours, the shares of stops made for non-moving violations tend to be somewhat lower for local law enforcement agencies than for the CHP.
About half or more of traffic stops made by local LEAs between 9 p.m. and 3 p.m. are for non-moving violations
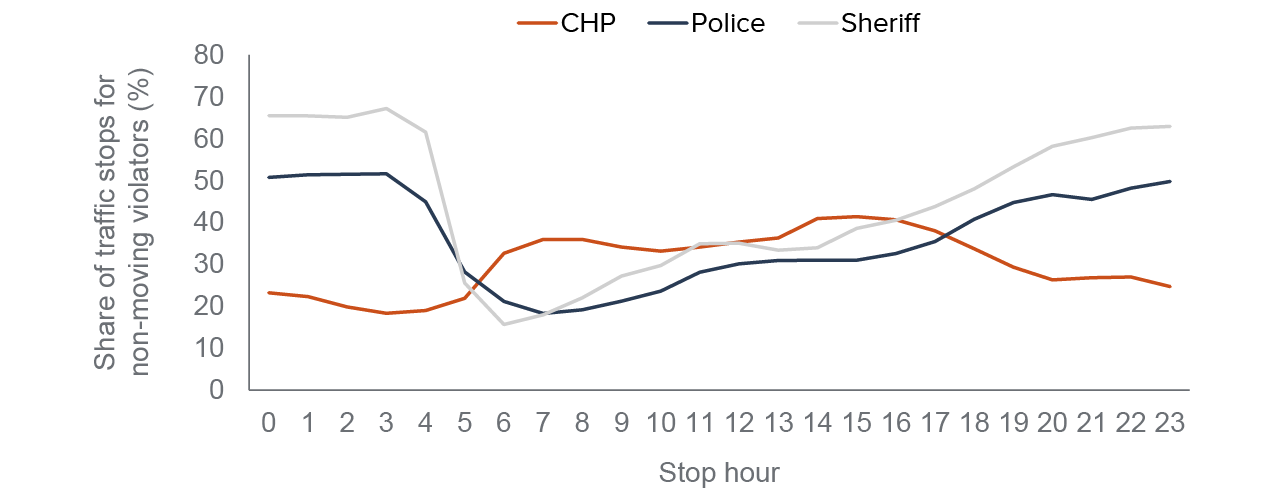
SOURCE: Author calculations using California Department of Justice, Racial and Identity Profiling Act (RIPA) Wave 2 data, 2019.
NOTE: Stop hours are shown using the 24-hour clock, sometimes referred to as “military time,” where 0 hour represents midnight.
In the Hours after Midnight, Searches Are More Common but Less Likely to Yield Contraband or Evidence
The likelihood of being searched during a traffic stop, or the search rate, varies notably throughout the day, from about one out of every hundred traffic stops during the peak morning commuting hours to about one out of every ten traffic stops from 8 p.m. to 3 a.m.
However, discovery rates—that is, how often searches yield contraband or evidence—in stops during the hours before midnight are overall no higher than at other times of the day, and discovery rates are notably lower during the hours after midnight. In fact, despite a relatively higher likelihood of being searched in the hours after midnight, searches made at this time are the least likely to yield contraband or evidence. Officers discover contraband or evidence in about 15 percent of searches in the hours after midnight, compared with 18–22 percent in searches during all other hours. This, however, differs quite widely across agencies and race/ethnicity (see Figure A1 in Technical Appendix A).
However, a number of guns are confiscated in traffic stops in the hours before and after midnight. In 2019, these 15 law enforcement agencies made 905 traffic stops that resulted in officers confiscating firearms; 47 percent (421) of these stops took place between 9 p.m. and 3 a.m. Of these stops, 51 percent (463) were for non-moving violations, at any time of day (320 by police officers, 98 by sheriff deputies, and 45 by the CHP). Altogether, traffic stops involving seizure of a firearm represented about 30 percent of the 3,024 stops of any kind in which a firearm was seized by these law enforcement agencies in 2019.
Stops by Local LEAs Are More Likely than CHP Stops to Lead to No Enforcement or Discovery
In the overwhelming majority of stops, there is at least some enforcement, measured here as at least a warning being issued. Traffic stops that lead to no enforcement and that do not yield any contraband or evidence are arguably the types of stops most deserving of closer examination, as they could potentially be considered for alternative enforcement methods without endangering public safety.
Of the close to 3.4 million traffic stops made by these 15 law enforcement agencies in 2019, only about 6 percent (about 211,000 stops) led to no enforcement or discovery of any contraband or evidence. But there is substantial variation depending on the time of day. For example, although stops made between 6 p.m. and 1 a.m. represent only about a third of overall traffic stops, more than half of no-enforcement/no-discovery traffic stops take place between those hours.
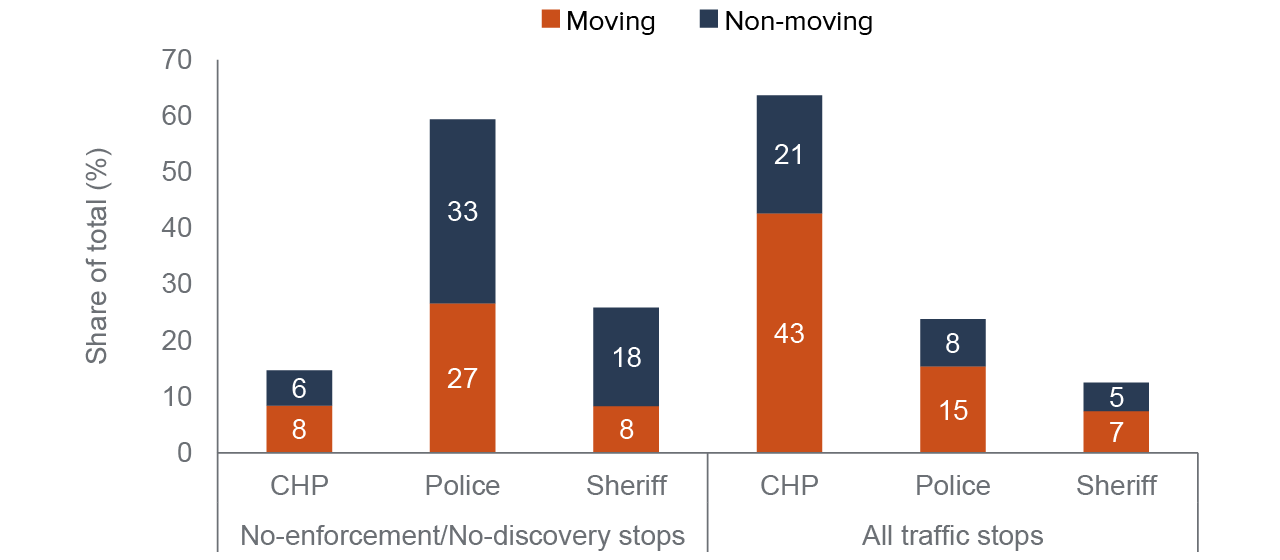
Figure 3 shows that stops by local law enforcement officers, especially police officers, disproportionately result in no enforcement or discovery. The CHP makes only 15 percent of traffic stops that result in no enforcement or discovery, despite making the majority of stops overall (64%). While the eight police departments account for slightly less than a fourth of overall traffic stops (24%), they make more than half of the traffic stops with no enforcement or discovery (59%). The six sheriff departments make about 13 percent of overall traffic stops and 26 percent of those with no enforcement or discovery. For local law enforcement, these stops are more likely to be for non-moving violations rather than moving violations.
Stops by local law enforcement disproportionately result in no enforcement or discovery
SOURCES: Authors’ calculations using California Department of Justice, Racial and Identity Profiling Act (RIPA) Wave 2 data, 2019.
NOTES: No enforcement is defined as not even a warning was issued. The figure shows the shares of moving and non-moving violation traffic stops made by each type of law enforcement agency in which there is no enforcement/no discovery of contraband or evidence (left three bars) and amongst all traffic stops (right three bars).
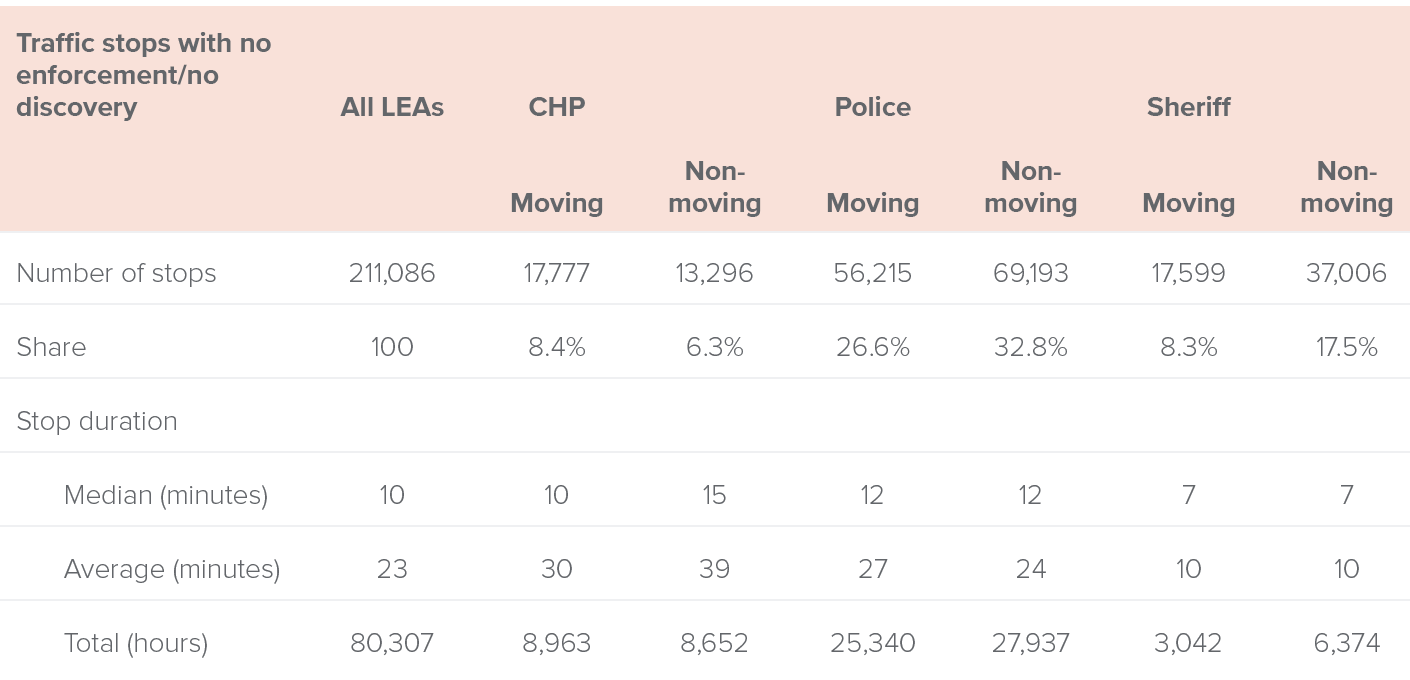
Lastly, as shown in Table 1, stops with no enforcement or discovery comprise a meaningful amount of officers’ (and civilians’) time. On average, these stops last about 23 minutes, but this is skewed by a relatively small share (about 5%) of stops in which the officer reports a duration longer than an hour. The median duration for this kind of traffic stop is 10 minutes. In addition, the length of the stop varies by agency type and to some extent the type of traffic violation. Notably, officers spent more than 80,000 total hours in 2019 on these types of stops (or 7% of total officer hours spent on traffic stops). For police departments, close to 28,000 of these hours were stops made for non-moving violations.
Officers spent more than 80,000 hours on no-enforcement/no-discovery stops in 2019
SOURCES: Authors’ calculations using California Department of Justice, Racial and Identity Profiling Act (RIPA) Wave 2 data, 2019.
NOTE: No enforcement is defined as not even a warning was issued.
In Stops that Lead to No Enforcement or Discovery, Local LEAs Are More Likely than the CHP to Take Intrusive Actions
The interaction between a civilian and an officer during a traffic stop can vary considerably. In addition to searches, officer actions can range from verbal communication to the civilian being asked to step out of the vehicle to the civilian being detained or handcuffed to—in rare cases—an officer aiming or using a weapon. We refer to this wide range of potential officer behaviors that extend beyond verbal communication as “intrusive actions.”
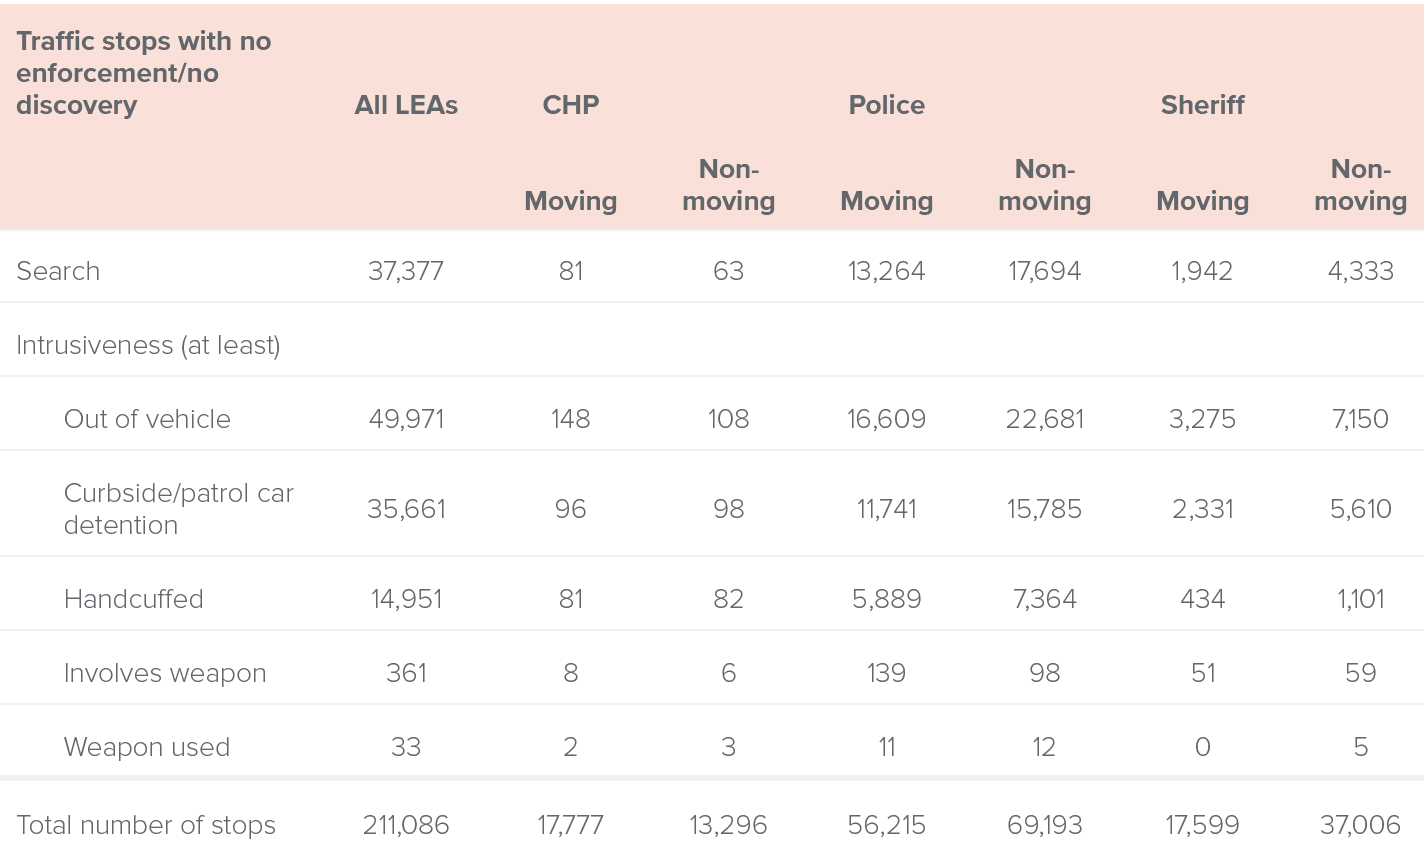
While the majority of no-enforcement/no-discovery traffic stops entail only verbal communication with the officer, a number of these stops include intrusive actions, as shown in Table 2. For example, in 24 percent of these stops (nearly 50,000), the individual was asked to step out of the vehicle. The individual and/or vehicle was searched for contraband or evidence in about 18 percent of these stops (almost 37,400), and the person was detained curbside or in a patrol car during 17 percent of these stops (about 35,700). In about 7 percent of no-enforcement/no-discovery stops (nearly 15,000), the person was temporarily handcuffed and then released. Out of the roughly 211,000 no-enforcement/no-discovery stops, an officer aimed a weapon in 361 of these stops (0.1%) and used a weapon in 33 of these stops (0.02%).
Many traffic stops with no discovery or enforcement involve intrusive actions, especially in stops by police
SOURCES: Authors’ calculations using California Department of Justice, Racial and Identity Profiling Act (RIPA) Wave 2 data, 2019.
NOTE: No enforcement is defined as not even a warning was issued.
These patterns differ across law enforcement agencies and types of violations. Table 2 shows that regardless of level, intrusive experiences are most common in stops for non-moving violations made by local law enforcement agencies. For example, in the nearly 15,000 instances in which the officer reported handcuffing the individual without any further enforcement or discovery, almost half were in stops for a non-moving violation made by the eight police departments.
In sum, the 2019 RIPA data show that while traffic stops peak during commuting hours, many stops take place during the late p.m. and early a.m. Searches for contraband and evidence are most likely to occur during these hours, while discovery of them are least likely in the early a.m. We also find that in about 6 percent of traffic stops there is no enforcement or discovery of contraband or evidence. About half of these stops take place in the late p.m. and early a.m., and almost 60 percent of these stops are made by the eight police departments—the majority for non-moving violations. During some of these no-enforcement/no-discovery stops, officers also report intrusive actions. For example, in about a quarter of these stops, the individual was asked to step out of the vehicle and in almost one in five, the individual and/or vehicle was searched for contraband or evidence.
Racial Disparities in Traffic Stops
A key motivation for this report is to identify traffic stops that can be targeted for changes in enforcement practices that could reduce racial disparities—possibly improving police efficiency and community relations without jeopardizing public and road safety. In this section, we examine overall racial disparities in traffic stops and whether racial disparities are especially large in stops that occur during certain times of day or for certain types of traffic violations.
On average, 40 percent of traffic stops are of Latino drivers, 33 percent are of white drivers, and 14 percent are of Black drivers. With about 6 percent of the state’s population, Black Californians are markedly overrepresented in traffic stops, as shown in Figure 4. Meanwhile, the share of traffic stops of Latinos is similar to their share of the population (40% of stops vs. 39% of the population), and white drivers are somewhat underrepresented in traffic stops (33% of stops vs. 35% of the population). At 6 percent of traffic stops, California’s growing Asian population, now at 15 percent, is notably underrepresented.
Black Californians are markedly overrepresented in traffic stops
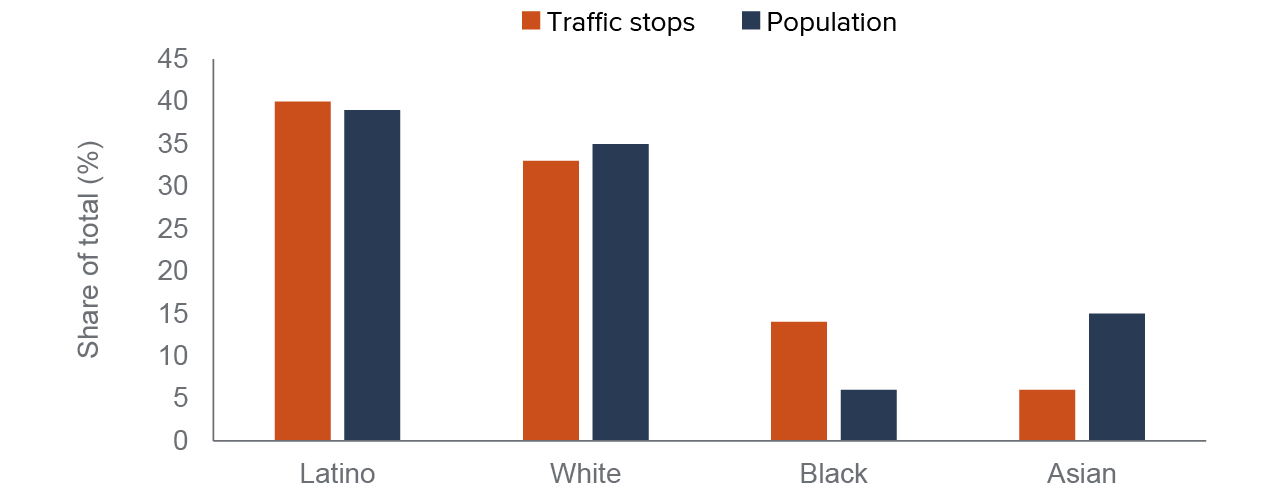
SOURCES: Stop share are authors’ calculations using California Department of Justice, Racial and Identity Profiling Act (RIPA) Wave 2 data, 2019. Population data comes from the California Department of Finance.
The racial composition of drivers stopped for traffic violations varies considerably throughout the day. The share of Black drivers changes most notably, from about 11 percent mid-morning to about 18–19 percent in the late p.m. and early a.m. hours. Depending on the time of day, Black drivers are between two and almost four times as likely to be stopped relative to their share of the population. As Figure 5 shows, the racial disparity is especially stark in traffic stops made by police departments, where Black drivers account for twice the share of white drivers in the hours before and after midnight (29%–34% vs. 15%–17%), despite making up a far smaller share of the population.
As discussed further below in our “veil of darkness” analysis, these disparities could be driven by racial bias, but other factors may also play a role. Vehicle conditions, driving patterns, and driving behaviors may differ across race/ethnicity, and this racial variation could contribute to disparities in the likelihood of being stopped for a traffic violation at a given time of day.
In stops by police departments, the largest racial disparities occur in the late p.m. and early a.m. hours
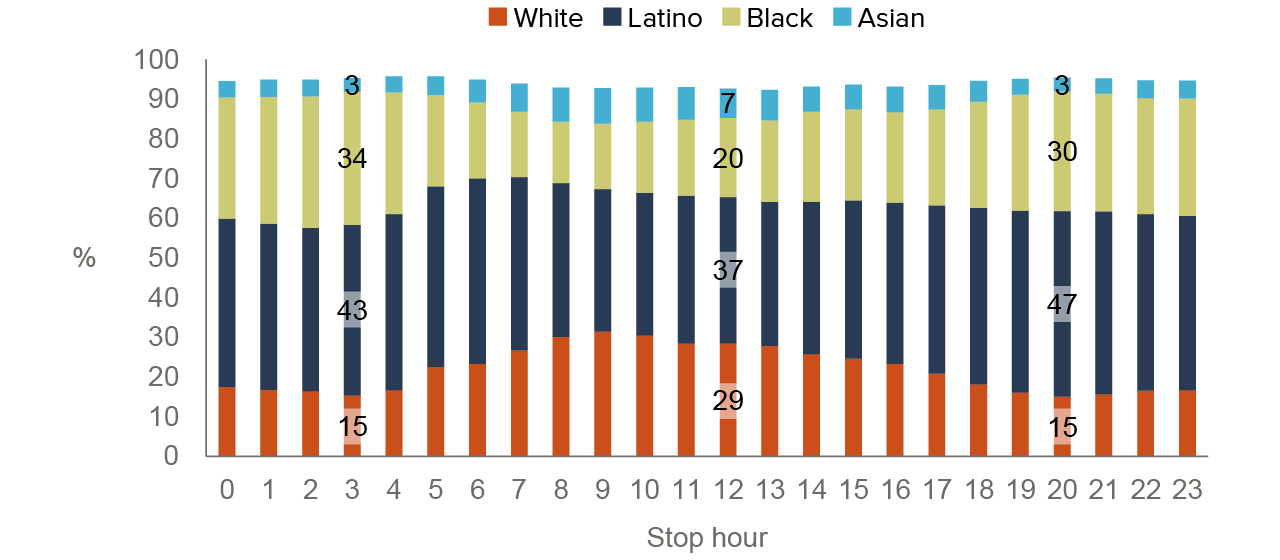
SOURCE: Authors’ calculations using California Department of Justice, Racial and Identity Profiling Act (RIPA) Wave 2 data, 2019.
NOTES: Stop hours are shown using the 24-hour clock, sometimes referred to as “military time,” where 0 hour represents midnight. Not all racial/ethnic groups in the RIPA data are shown in the figure, thus each bar will not add up to 100 percent. The racial/ethnic groups omitted in the figure are individuals perceived by the officer to be Middle East/South Asian, Pacific Islander, Native American, or multi-racial/ethnic.
In Local LEA Stops, Search Rates for Black and Latino drivers Are Higher and Discovery Rates Are Lower
The likelihood of being searched during a traffic stop varies across race and ethnicity as well as across agency type. Black drivers stopped by local police and sheriff departments are searched in 20 percent of traffic stops, while the search rates for Latino and white drivers are 13 percent and 6 percent, respectively. The likelihood of being searched, and racial disparities therein, are notably smaller in traffic stops made by the CHP. On average, about 1.9 percent of Latinos stopped for a traffic violation by the CHP are searched for contraband, compared to 1.5 percent and 1.2 percent of Black and white drivers, respectively.
Disparities in search rates vary noticeably throughout the day for local law enforcement stops, but not markedly for CHP stops, as shown by the solid lines in Figure 6 (numbers closer to zero reflect lower disparities at those times of day). The disparities in local law enforcement stops are especially stark between 4 p.m. and midnight. While roughly one in ten white drivers stopped by local law enforcement in the late evening are searched for contraband or evidence, about one in four Black drivers and one in five Latino drivers are searched. Meanwhile, the somewhat higher search rate of Latinos compared to white drivers in CHP traffic stops is similarly driven by stops made in the late p.m. and early a.m.
The higher search rates of Latino and Black drivers in traffic stops made by local law enforcement are not associated with higher rates of discovery of contraband or evidence. In fact, discovery rates are markedly lower for Black and Latino drivers (at about 19% for both) than for white drivers (25%)—as shown by the negative numbers for the dotted lines in the top panel of Figure 6, which compares the discovery (or “hit”) rates for Black and Latino drivers with those of white drivers. In searches in traffic stops made by the CHP, disparities are negligible during most hours of the day, and disparities in discovery rates are inconsistent throughout the day. Overall, the discovery rates in CHP stops are 13 percent, 12 percent, and 9 percent for white, Black, and Latino drivers, respectively.
As the bottom panel in Figure 6 shows, for CHP stops, the disparities in discovery rates fluctuate throughout the day, with higher discovery rates in searches of people of color during certain daytime hours. Note, however, that the likelihood that a CHP officer will conduct a search at this time of the day is very low, in only about 0.2–0.3 percent of stops, regardless of race/ethnicity. The discovery rates in these searches are markedly higher (between 20% and 40%) in these relatively rare searches, suggesting that they largely take place when the officer sees or smells contraband or evidence and/or that a higher threshold for engaging in a search results in more efficient discovery of contraband/evidence.
Racial disparities in search rates are highest in local LEA stops between 4 p.m. and midnight, but discovery rates are lower
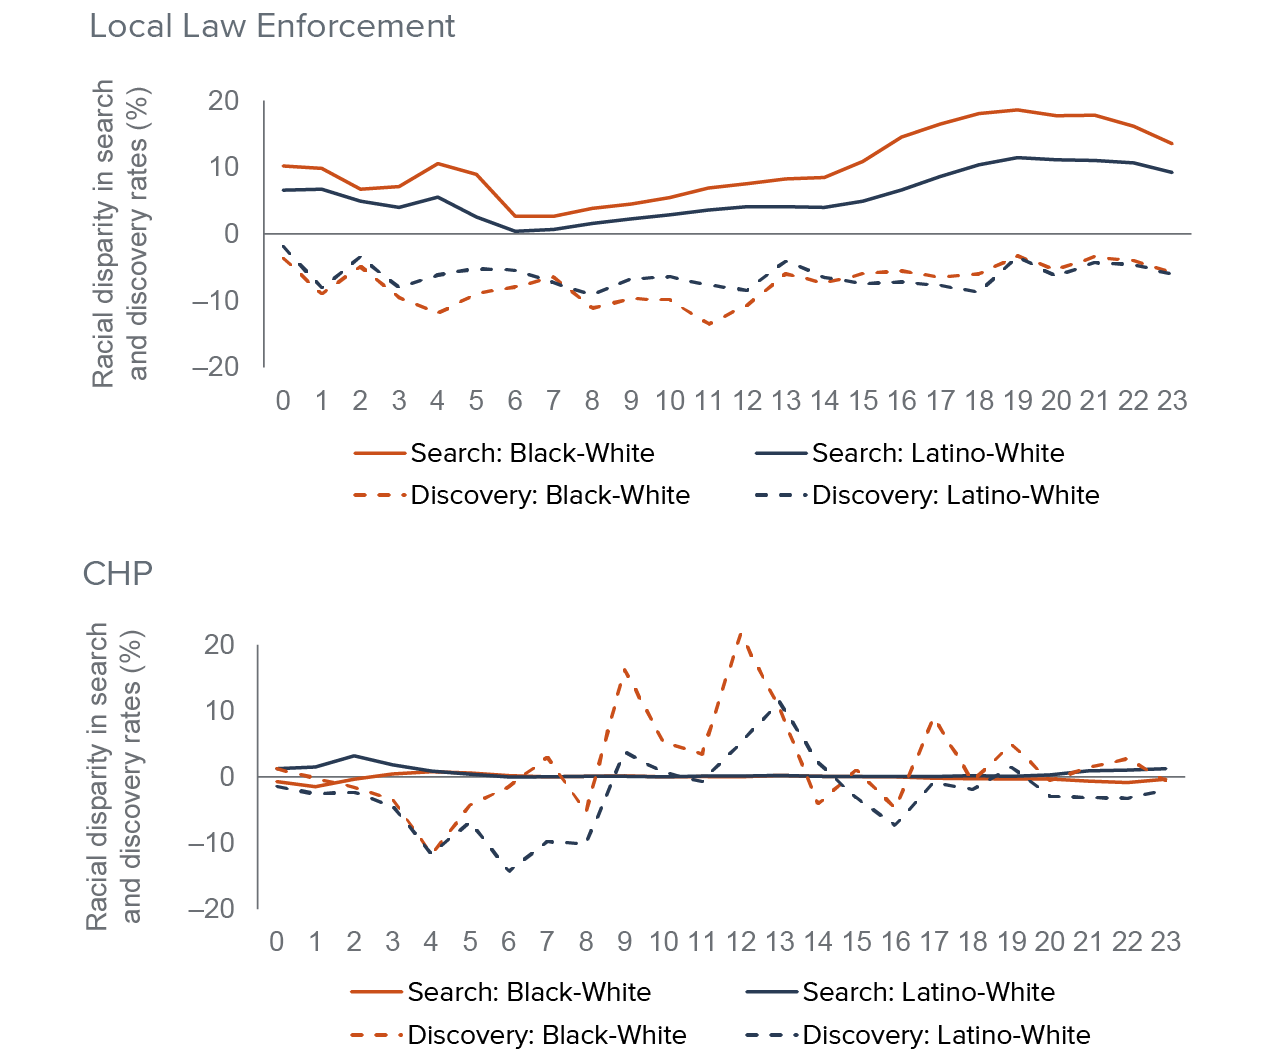
SOURCE: Authors’ calculations using California Department of Justice, Racial and Identity Profiling Act (RIPA) Wave 2 data, 2019.
NOTES: Figures show percentage point differences in search and discovery rates between Black and white individuals and white and Latinos. Stop hours are shown using the 24-hour clock, sometimes referred to as “military time,” where 0 hour represents midnight.
Racial Disparities in Stops with No Enforcement or Discovery Are Higher for Local LEAs
For the CHP, the shares of no-enforcement/no-discovery stops of white, Black, and Latino drivers do not differ much (about 1.4%–1.5% for all three groups). However, these shares do vary significantly in local law enforcement stops, from 11 percent for white drivers to 15 percent and 22 percent, respectively, for Latino and Black drivers.
As Figure 7 makes clear, racial disparities in stops with no enforcement or discovery made by local law enforcement also fluctuate considerably throughout the day and are especially stark in the late p.m. and early a.m. hours. During these hours, almost a third of traffic stops made by local law enforcement of Black drivers do not result in any enforcement, nor is any contraband or evidence discovered. The figure also shows that about a fourth of stops of Latinos during this time do not lead to any enforcement or discovery. In the hours after midnight, roughly a fourth of stops of white drivers do not lead to any enforcement or discovery, while this share is closer to a fifth in the hours leading up to midnight. (Racial disparities are not apparent among CHP’s no-enforcement/no-discovery stops across time of day; see Technical Appendix Figure A6.)
For local LEAs, almost a third of stops of Black drivers around midnight do not result in any enforcement or discovery
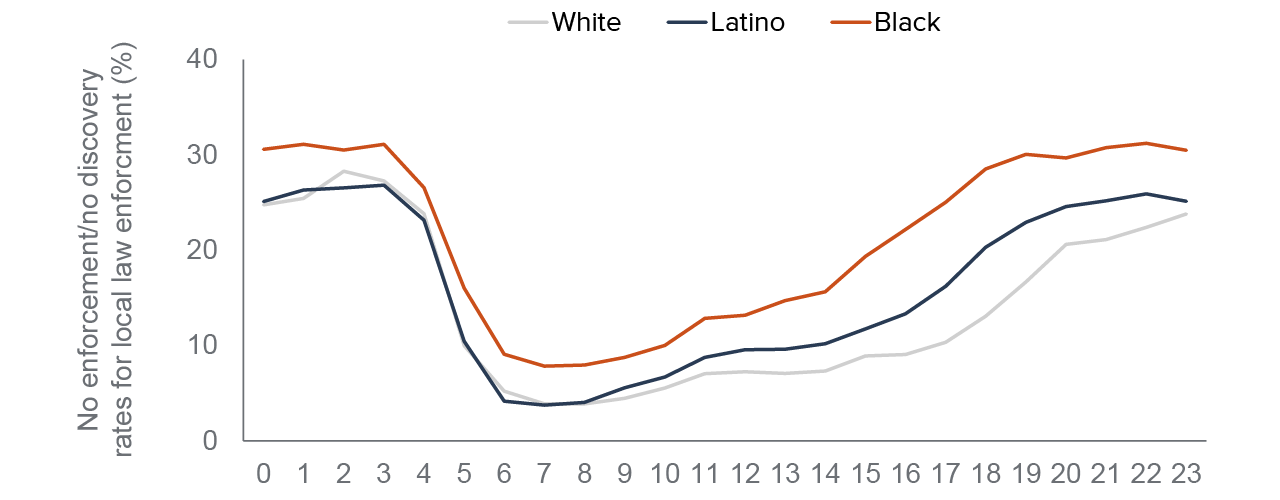
SOURCE: Authors’ calculations using California Department of Justice, Racial and Identity Profiling Act (RIPA) Wave 2 data, 2019.
NOTE: Stop hours are shown using the 24-hour clock, sometimes referred to as “military time,” where 0 hour represents midnight.
Black and Latino Drivers Are Overrepresented in No-Enforcement/No-Discovery Stops that Involve Intrusive Actions
As noted above, a small number of traffic stops involve intrusive actions despite not even a warning being issued and no contraband or evidence being found. Such stops occur disproportionately with Latino and Black individuals. For example, out of almost 36,000 traffic stops that involve at least a curbside or patrol car detention, 46 percent are in stops of Latino drivers and 36 percent in stops of Black drivers (Figure 8). The Black share is especially striking: Black drivers are about 2.5 times more likely than white drivers (14%) to be detained, despite comprising a significantly lower share of the population. Similar levels of racial disparity are present across other intrusive actions.
Black drivers comprise over a third of no-enforcement/no-discovery stops that involve intrusive actions
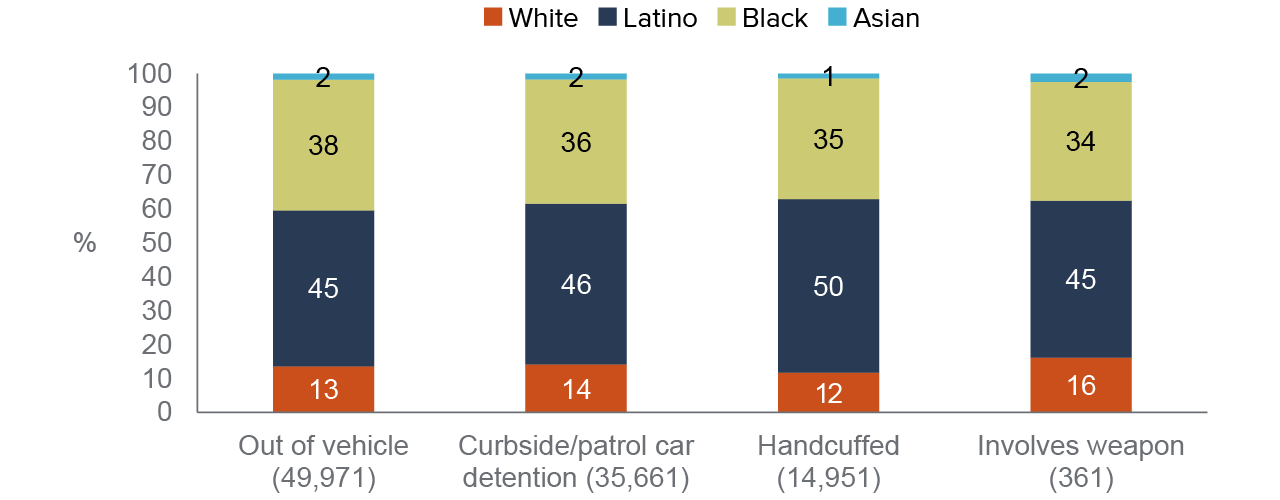
SOURCE: Authors’ calculations using California Department of Justice, Racial and Identity Profiling Act (RIPA) Wave 2 data, 2019.
NOTE: The numbers in parentheses refer to the total number of stops where the person experienced at least this level of intrusiveness, out of the 211,089 traffic stops with no enforcement and there was no discovery of contraband or evidence.
The main source of inequity in intrusive experiences is local law enforcement stops, especially police stops, and the majority of these are for non-moving violations. For example, police departments account for 89 percent of the nearly 15,000 no-enforcement/no-discovery stops in which the individual is handcuffed (49% for non-moving violations; 40% for moving violations). Meanwhile, sheriff departments account for 10 percent of these stops (7% non-moving violations; 3% moving violations). Finally, the CHP makes up only 1 percent of no-enforcement/no-discovery stops in which the individual is handcuffed (0.5% non-moving violations; 0.5% moving violations).
Overall, Black drivers are notably overrepresented in traffic stops relative to their share of the population (14% of traffic stops vs. 6% of the population), and these disparities vary across time of day and agency type. In stops by police departments, for example, Black drivers make up as many as a third of traffic stops in the hours after midnight, roughly twice the share of white drivers. Racial disparities in search and discovery rates are also more evident among local law enforcement stops in the late evening hours. While roughly one in ten white drivers stopped by local law enforcement during this time are searched for contraband or evidence, about one in four Black drivers and one in five Latino drivers are searched. However, searches of Black and Latino drivers during this time are less likely than at other times of day to yield contraband or evidence. We also see racial disparities in enforcement. For local LEAs, almost a third of stops of Black drivers around midnight do not result in any enforcement or discovery. Finally, Black and Latino drivers are overrepresented among no-enforcement/no-discovery stops that involve intrusive actions, including being asked to step out of the vehicle, being detained, being handcuffed, or an officer aiming or using a weapon.
Testing for Racial Bias in Policing
Does racial bias in policing contribute to racial disparities in traffic stop outcomes? Before diving into the RIPA data, it is worth noting that research consistently finds evidence of racial bias, explicit and/or implicit, broadly in society (see, for example, Bertrand and Mullainathan 2004; Bayer et al. 2017; Rothstein 2017; Avenancio-Leon and Howard 2019; Chetty et al. 2020; Kline, Rose, and Walters 2021). Furthermore, research has also found racial discrimination within the criminal justice system in jury, judge, and prosecutor decisions (Anwar, Bayer, and Hjalmarsson 2012; Arnold, Dobbie, Yang 2018; Sloan 2019). There is also a body of research that finds evidence of racial bias in policing (Fryer 2019; Luh 2019; Ba et al. 2021a; Feigenberg and Miller 2021; Goncalves and Mello 2021; Lofstrom et al. 2021; Premkumar et al. 2021; Hoekstra and Sloan 2022).
Our analysis above shows that Black drivers are overrepresented in traffic stops relative to their share of the population. However, this in and of itself is not necessarily indicative of racial bias. Driving patterns and behaviors (due to work, school, shopping, and entertainment)—as well as vehicle conditions—may also differ across race/ethnicity (see, for example, Grogger and Ridgeway 2006 and Horrace and Rohlin 2016). These differences mean that the demographic composition of drivers in any particular area and at a particular time may differ from the residential population, rendering the residential population an inappropriate benchmark to represent the likelihood that different racial/ethnic groups would be stopped for traffic violations. To circumvent some of these challenges, we employ an analytical method based on the “veil of darkness” theory to test for racial bias in traffic stops.
The veil-of-darkness theory posits that light conditions affect officers’ ability to determine the race/ethnicity of a driver and that it is more difficult to ascertain a person’s race or ethnicity during dark hours. If racial profiling is a factor influencing officers’ decisions to stop drivers, the share of people of color in traffic stops would be lower during dark hours, compared to light hours, holding everything else constant. But simply comparing daytime and nighttime stops would not account for differences in driving patterns and behaviors across racial/ethnic groups and times of day. Instead, we exploit the sudden change in daylight that occurs at specific and location-dependent times in early March and November during the annual shift to and from Daylight Saving Time (DST). For example, in Southern California, it was light between 6:00 a.m. and 6:55 a.m. before DST started on March 10, 2019, but dark between 6:00 a.m. and 6:55 a.m. right after the switch. There was also an opposite switch, from dark to light, between 6:40 p.m. and 7:35 p.m. on March 10. Similar changes in light conditions can also be identified in November. The veil-of-darkness theory predicts that if there is racial bias in traffic stops, the share of people of color stopped will decrease when light conditions switch from light to dark and increase when light conditions switch from dark to light.
Given that there are light-to-dark and dark-to-light switches on each DST switch date in March and November, our approach has the benefit of predicting opposite changes to the shares of Black and Latino drivers for a given DST switch date, and is hence less susceptible to concerns about underlying trends and seasonality. Given that we see distinct differences in racial disparity in traffic stops between CHP and local law enforcement, and that their missions and objectives differ, we separately test this theory for each type of law enforcement agency. In our analysis, we assume that driving behavior and patterns do not sharply change during these sudden switches in light conditions, or that changes are uniform across race/ethnicity. As light conditions are seasonal and change over time, we limit our study period to the two-week periods before and after the DST switches in March and November.
As with most tests of the veil-of-darkness theory, our analysis may be limited by lack of statistical power—meaning we may not find evidence of bias even if it exists. Given that we focus on brief, specific times of the day, for only four weeks, and we examine racial/ethnic groups and law enforcement agencies separately, our sample sizes are limited. This is a particular concern for studying Black drivers, who, although they are overrepresented compared to their share of the statewide population, are a relatively small minority of drivers during the hours examined here.
Another important note is that this is a single and specific test of racial bias. Though an affirmative result would provide evidence that racial bias contributes to the observed racial disparities, a negative result would not conclusively show that there is no racial bias in policing, but rather indicate that there is no evidence of it in the decision to stop someone for a traffic violation during the morning and evening hours analyzed—times of the day when racial disparities are not especially large, as our analysis above shows.
The RIPA Data Provide Some Evidence of Racial Bias in Policing
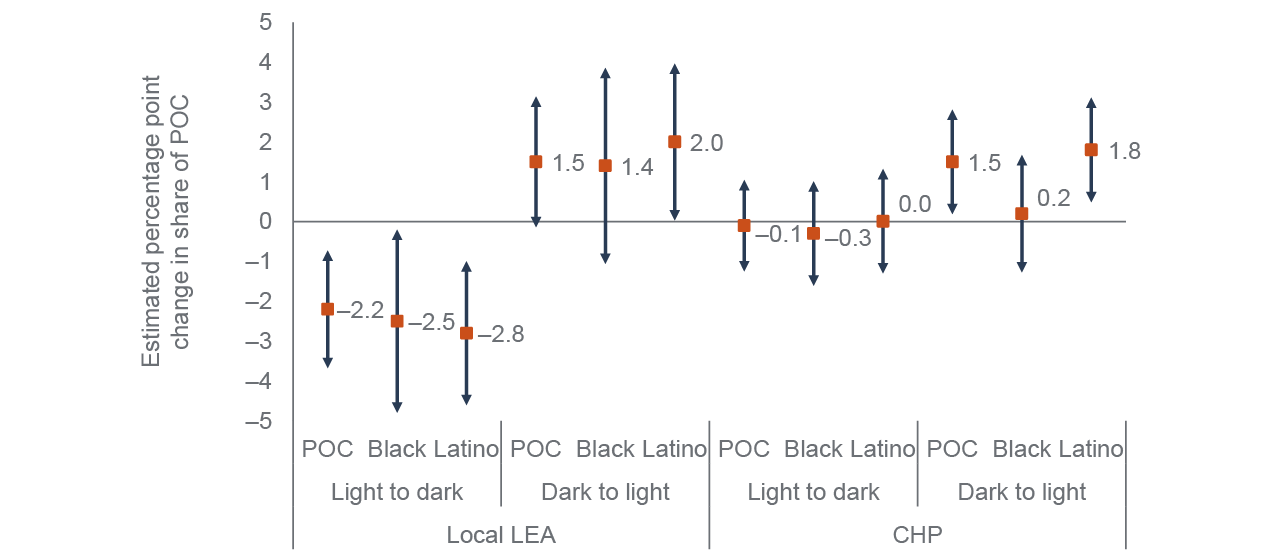
Our estimates provide some evidence of racial bias in the likelihood of being stopped for a traffic violation. As Figure 9 shows, in stops made by local law enforcement agencies, we find decreases in stops of Black and Latino drivers when conditions suddenly switch from light to dark. Specifically, the shares of stops fall by 2.2 percentage points when we combine Black and Latino drivers, and by 2.5 percentage points and 2.8 percentage points, respectively, when we estimate the effects separately (detailed results can be found in Technical Appendix Tables A1–A3). Conversely, the shares of stops of Black and Latino drivers increase by 1.4–2.0 percentage points when light conditions switch suddenly from dark to light. The estimates are statistically significant at the 10 percent level, except for the change in the share of Black drivers during the switch from dark to light.
For CHP stops, we do not find evidence of police bias for Black drivers, but there is some evidence of bias in stops of Latinos, limited to the switch from dark to light. The share of Latino drivers stopped increases by 1.8 percentage points, while the share of Black drivers is essentially unchanged.
RIPA data provide some evidence of racial bias in local law enforcement’s stopping behavior before and after Daylight Savings Time
SOURCE: Authors’ calculations using California Department of Justice, Racial and Identity Profiling Act (RIPA) data, 2018–2020.
NOTES: The numbers by the orange markers represent the estimated change in the share of Black and Latino drivers stopped for a traffic violation, relative to white drivers, as a result of the sudden changes in light conditions, as a result of DST switches. The length of the bars represent 90 percent confidence intervals. Estimates with bars not crossing the horizontal axis (at zero) are statistically significant at the 10 percent level.
In some cases, it is possible that officers could have more difficulty ascertaining a driver’s race and ethnicity for moving violations (such as a speeding violation) than for non-moving violations (such as improper display of license plate). To examine and account for such possible differences, we estimate separate models for moving and non-moving violations. This approach, however, is challenged further by sample size limitations, resulting in less precise estimates.
The estimates potentially suggest greater racial bias in stops by local law enforcement of Black drivers for non-moving violations. The share of Black drivers stopped for non-moving violations decreases by about 4 percentage points when conditions switch from light to dark, and is statistically significant at the 10 percent level (see Technical Appendix Table A4). This is roughly twice the estimated decrease in the share of Black drivers in stops for moving violations. The estimated increase in the share of Black drivers when light conditions switch from dark to light is roughly the same for moving and non-moving violations.
In contrast, the estimates for local law enforcement stops point toward greater racial bias in stops of Latino drivers for moving violations. The share of Latino drivers decreases by a statistically significant 2.7 percentage points (at the 10 percent level) when light conditions switch from light to dark and increases by 3.1 percentage points (statistically significant at the 5 percent level) when conditions change from dark to light. The estimates for non-moving violations are not statistically different from no change, but given their imprecision (possibly due to the fact that the sample size is less than half of the sample size for stops for moving violations), we cannot reject the hypothesis that they are the same as for stops for moving violations.
The analysis of CHP stops does not reveal any evidence of racial bias for moving violations but provides some evidence of racial bias for non-moving violations. The shares of Black and Latino drivers decrease with the switch from light to dark but only the change in the share of Black drivers (dropping by 2.5 percentage points) is statistically significant at the 10 percent level (see Technical Appendix Table A5). The share of Latino drivers stopped for non-moving violations by the CHP increases by 2.3 percentage points when going from dark to light, but this is not statistically significant.
Our tests of racial bias in local law enforcement stops motivated by the veil-of-darkness theory point consistently toward bias in stop decisions of both Latino and Black drivers, with some possible differences between stops for moving and non-moving violations. The evidence of racial bias is less consistent in traffic stops made by the CHP, though it is somewhat stronger in CHP stops for non-moving violations.
Conclusion and Recommendations
Traffic stops, especially for non-moving violations, have recently been the target of proposed reforms in a few California cities and elsewhere in the country, including the state of Virginia. A key motivation for these often-controversial efforts are concerns that people of color are targeted in these stops. Proponents of reform argue that these are mostly “pretextual stops,” in which non-moving violations are used as justification for conducting a stop that is not based on reasonable suspicion of criminal activity, and that such stops do little to increase public or road safety. Critics, including some in law enforcement, state that limiting officers’ ability to make these stops would jeopardize public safety and prevent officers from removing drugs and, especially, guns from the streets.
Our previous research finds that racial disparities in experiences with law enforcement officers in California stem primarily from traffic stops made by police and sheriff departments, and that traffic and pedestrian stops comprise about 15 percent of law enforcement encounters in which a civilian is seriously injured or killed (Lofstrom et al. 2021; Premkumar et al. 2021). In this report, we build on that work in an effort to generate data-driven research to identify police stops deserving of consideration for alternative enforcement practices that would not jeopardize public or road safety, but that could lead to a number of benefits, including increased safety for officers and civilians, improved police efficiency, and, importantly, reduced racial disparities.
Our findings suggest that traffic stops in the late p.m. and early a.m. hours, especially those made by local police and sheriff departments for non-moving violations, deserve consideration for alternative enforcement methods. While most traffic stops result in some enforcement (i.e., at least a warning) or discovery of contraband or evidence, officers in the state’s 15 largest law enforcement agencies reported about 211,000 stops in 2019 that led to no enforcement or discovery, and almost half of these stops took place between 6 p.m. and 1 a.m. Altogether, no-enforcement/no-discovery stops took more than 80,000 hours of officer time. Stops by police departments for non-moving violations account for close to 28,000 of these hours.
Black drivers are overrepresented in traffic stops throughout the day. But the disparity is especially stark in stops made by police departments in the few hours before and after midnight, when Black drivers account for about a third of traffic stops—despite comprising only 6 percent of the statewide population. In addition, while roughly one in ten white drivers stopped for a traffic violation by local law enforcement (either police or sheriff departments) during these hours are searched for contraband or evidence, about one in four Black drivers and one in five Latino drivers are searched. However, the discovery rates are consistently lower in searches of people of color compared to white drivers, regardless of the time of day.
Our analysis also finds that Black and Latino drivers are notably more likely to be stopped for a traffic violation that does not result in any enforcement or discovery of contraband or evidence. Furthermore, Latino drivers and, especially, Black drivers are more likely than white drivers to experience intrusive actions during these stops. While the vast majority of these stops do not go beyond verbal communication with the officer, thousands of them involve being searched (37,400 stops), detained (35,700), or handcuffed (15,000). In rare cases, officers aim or use a weapon during traffic stops that do not lead to any enforcement or discovery.
Potential alternative approaches to enforce traffic laws include mailing warnings or citations to the registered owner of the vehicle, especially if the reason for the stop is a non-moving violation and concerns about road safety may not be immediate. Alternative enforcement methods for moving violations are also possible. While automated speed cameras are currently not legal in California, they are used in many jurisdictions across the nation, and the National Transportation Safety Board found them to be an effective tool to reduce speeding-related crashes (NTSB 2017). Red light cameras are legal and used in California, and have been found by the Insurance Institute for Highway Safety to reduce traffic violations and crashes (IIHS 2022). These strategies have the additional advantage of reducing discretion in enforcement decisions, which could also lead to decreases in racial inequities in policing (Council on Criminal Justice 2021).
Implementation of alternative enforcement should be balanced against the possibility that changes may hamper efforts to confiscate dangerous contraband, especially firearms, a concern at times voiced by law enforcement. The RIPA data show that some guns are indeed seized during traffic stops. Overall, officers confiscated firearms in 905 out of the close to 3.4 million traffic stops that took place in 2019 (officers also seized firearms in 2,119 out of the roughly 600,000 non-traffic stops). Slightly more than half of these stops were for non-moving violations, primarily made by police departments, and a little less than half took place in the few hours before and after midnight.
Lastly, our results from testing the veil-of-darkness theory provide evidence of racial bias as a contributing factor to racial disparities in traffic stops for Black and Latino drivers, underscoring the urgency of efforts that can reduce these inequities. While implicit bias training for officers is a frequent tool, research support of its effectiveness is not strong and further evaluative research is needed (Council on Criminal Justice 2021; Machado and Lugo 2021). Another approach to consider is diversifying police staff. While there are practical challenges to recruiting police staff, recent research finds evidence that such efforts may well reduce racial inequities, and suggests reallocating officers to calls from same-race/ethnicity neighborhoods as a complementing approach (Ba et al. 2021a; Hoekstra and Sloan 2022). Officer experience and seniority is another factor that likely matters, and Ba et al. (2021b) find evidence suggesting that equalizing officer seniority across districts within a law enforcement agency jurisdiction may reduce racial inequities and improve public safety.
Given the inherent risks involved in traffic stops, successful implementation of alternative enforcement strategies for non-moving violations, especially during nighttime hours, has the potential to maintain public and road safety, while improving officer and civilian safety, enhancing police efficiency, and reducing racial inequities. Implementation of these efforts should include rigorous assessments of their impacts on these important outcomes.
Topics
Criminal Justice PopulationLearn More
How Often Are Firearms Confiscated During Traffic Stops?
Law Enforcement Staffing in California
Police Use of Force and Misconduct in California
Police Use of Force and Racial Disparities during Traffic Stops
Racial Disparities in Law Enforcement Stops
