Table of Contents
- Key Takeaways
- Introduction
- RIPA Data on Police Stops
- Differences in Stop Experiences
- Differences in Context of Stops
- Differences in Searches
- Differences in Enforcement
- Differences in Intrusive Actions
- Differences in Agency Stops
- Conclusion
- Notes and References
- Authors and Acknowledgments
- PPIC Board of Directors
- Copyright
Key Takeaways
Racial disparities within the criminal justice system continue to be a pressing issue for the US and California. In the wake of the killing of George Floyd, discussions around police reforms have heightened and centered on how law enforcement engages with people of color.
In this report, we analyze data for almost 4 million stops by California’s 15 largest law enforcement agencies in 2019, examining the extent to which people of color experience searches, enforcement, intrusiveness, and use of force differently from white people. While it is important to caution the reader that analysis of these differences is not causal, our analysis—which focuses in particular on differences between Black and white Californians—reveals notable differences.
- Black Californians are more than twice as likely to be searched as white Californians, at about 20 percent versus 8 percent of all stops. →
- Searches of Black civilians are somewhat less likely to yield contraband and evidence than searches of white civilians. Overall, searches yielded contraband or evidence in about one-fifth of all searches. →
- Black people are overrepresented in stops not leading to enforcement—defined as an officer declining to issue even a warning—as well as in stops leading to an arrest. →
- Black individuals are almost twice as likely to be booked into jail as white individuals. →
- While differences in locale and context for the stop—such as when an officer has knowledge of an outstanding warrant—significantly contribute to racial disparities, notable inequities remain after accounting for such factors.
These disparities are driven primarily by traffic stops made by the 14 data-contributing police and sheriff departments (as compared with the California Highway Patrol). These findings can provide guidance for discussing which stops can safely be reduced to mitigate racial inequities, which may also reduce risks and injuries to both officers and civilians.
Introduction
While the nation grappled with the greatest public health crisis in at least a century—a pandemic in which communities of color carried the heaviest burden—the killing of George Floyd, among others, sparked civil unrest around California and the country. This unrest further highlighted stark racial inequities in our criminal justice system and the need for reform.
Inequities are especially stark between Black and white individuals: while Black residents make up about 6 percent of California’s population, roughly 16 percent of all arrests are of Black residents. Disparities are even greater at later stages in the criminal justice process, where Black people account for about 25 percent of county jail populations, about 26 percent of the probation population, and 29 percent of the prison population.
A recent PPIC survey found that 62 percent of Californians believe that the criminal justice system is biased against African Americans. Among African Americans, 88 percent hold this view. And while 54 percent of adults in California say police treat all racial and ethnic minorities fairly “almost always” or “most of the time,” only 18 percent of African Americans share that view.
Recognizing the need for data and research on law enforcement stops, the California legislature passed the Racial and Identity Profiling Act (RIPA) in 2015. The legislation—which was rolled out in waves based on the size of the agency—will require all law enforcement agencies in California to collect officer-perceived demographic and other detailed data for all pedestrian and traffic stops by 2023. The most recent data available include nearly 4 million stops made in 2019 by the 15 largest law enforcement agencies in the state.
This report builds on our previous work on arrests in California that found that criminal justice reforms implemented over the last decade have reduced racial disparities in arrests, bookings, and incarceration (Lofstrom et al. 2020; Lofstrom, Martin, and Raphael 2020). However, wide gaps remain. Here we broaden the scope to law enforcement stops, which include the many interactions Californians have with law enforcement that do not lead to arrests.
Complementing the 2021 RIPA Board report, we analyze the most recent stop data to better understand how interactions with law enforcement vary across race and ethnicity. Given that the starkest disparities are between Black and white Californians, our research focuses on inequities between these groups in frequency of stops, reasons for stops, and outcomes to provide a more complete picture of what those experiences are like.
We examine the likelihood that the individual stopped is searched, whether the search yielded any contraband or evidence, and if the stop resulted in any enforcement measures. We also examine intrusiveness and use of force, measured by reported outcomes such as being asked to step out of the vehicle, being handcuffed, and the involvement of an officer’s weapon. We then separately analyze outcomes by statewide (California Highway Patrol) and local (police and sheriff’s departments) jurisdictions.
RIPA Data on Police Stops
The California state legislature passed the Racial and Identity Profiling Act (RIPA) in 2015 (AB 953), which requires all law enforcement agencies in California to collect perceived demographic and other detailed data regarding all pedestrian and traffic stops by 2023 (see Technical Appendix A for more details). “Stop” is defined as any detention by a peace officer of a person, or any peace officer interaction with a person in which the officer conducts a search.
The data elements mandated by statute include person-level and stop-level information. For person-level data, which we refer to throughout as personal traits, officers are required to record their perception of the identity characteristics for each individual stopped, including
- race or ethnicity
- gender
- approximate age
- lesbian, gay, bisexual, or transgender (LGBT) status
- English fluency
- disability (including behavioral health status)
Officers are prohibited from asking the person stopped to self-identify these characteristics.
Stop-level elements include
- reason for stop (including a traffic violation, reasonable suspicion, parole/probation/mandatory supervision, knowledge of outstanding arrest warrant/wanted person, and consensual encounter resulting in search)
- action taken by officer during stop (such as suspect removed from vehicle, removed from vehicle by physical contact, curbside detention, handcuffed, canine search, use of electronic device, chemical spray, or use of firearm)
- reason for search (probable cause, consent, search warrant, visible contraband, odor of contraband, etc.)
- contraband or evidence discovered (such as guns, drugs, drug paraphernalia, alcohol, money, or stolen property)
- enforcement result of stop (including no action, warning, citation, cite and release, and booking)
The data do not allow for corroborating the accuracy of the reported information, including the race and identity of the individual stopped and the specific actions taken by the officer. Nor do the data include information on the race and ethnicity of the officer.
We examine the most recent available data from the 15 law enforcement agencies who submitted their first full year of stop data from 2019. This includes California Highway Patrol (CHP), eight police departments (Los Angeles, San Diego, San Francisco, Sacramento, Fresno, San Jose, Long Beach, and Oakland) and six county sheriff’s departments (Los Angeles, San Bernardino, Sacramento, San Diego, Riverside, and Orange County).
These agencies recorded 3,992,074 stops of motorists and pedestrians during the 2019 calendar year. Technical Appendix A provides details and a discussion of how the distribution of stops and outcomes vary across agencies.
Disparities in Stops and Reasons for Stops
A primary objective of this report is to examine disparities between the experiences and outcomes Black and white Californians have during a stop. To start, we examine racial disparities in the frequency of being stopped by law enforcement, and disparities in the reported reason for the stop.
When we compare shares each group represents in stops to shares by population, we find considerable disproportionality statewide. Black residents accounted for 16 percent of stops made by all participating law enforcement agencies during 2019 (Figure 1) but constituted only 7 percent of the state’s population. Residents identified by law enforcement as Middle Eastern or South Asian were also overrepresented in stops (5%) compared to their share of the state’s population (2%).
White residents were represented fairly proportionally in stops (33%), compared with their population share (34%), as were Latino residents (39% and 41%, respectively). Asian individuals were underrepresented in stops (6%) compared with their share of the population (12%), as were multiracial residents (1% and 3%, respectively).
Individuals identified as Pacific Islanders were overrepresented (0.5% of stops, compared with 0.3% of the population), and those identified as Native American were underrepresented (0.2% and 0.3%, respectively). The percentage-point differences are small, but as a proportion of the population share, these differences are considerable. Again, the racial/ethnic identification comes solely from the officer making the stop.
Black residents are overrepresented in police stops
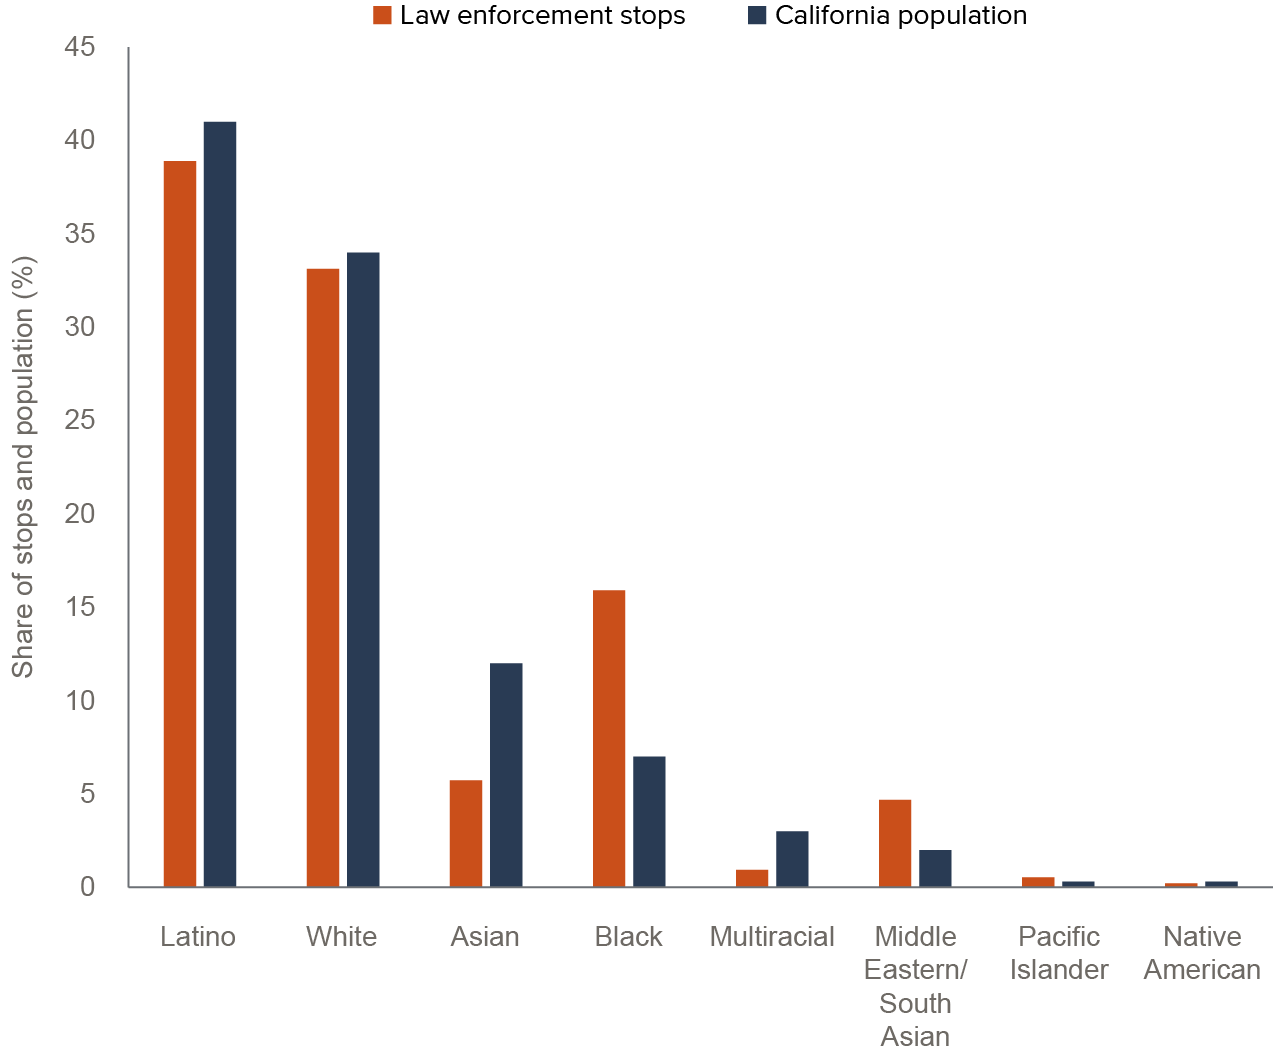
SOURCES: Author calculations using California Department of Justice, Racial and Identity Profiling Act (RIPA) Wave 2 data, 2019; RIPA Board Report 2021 population calculations using American Community Survey (2018).
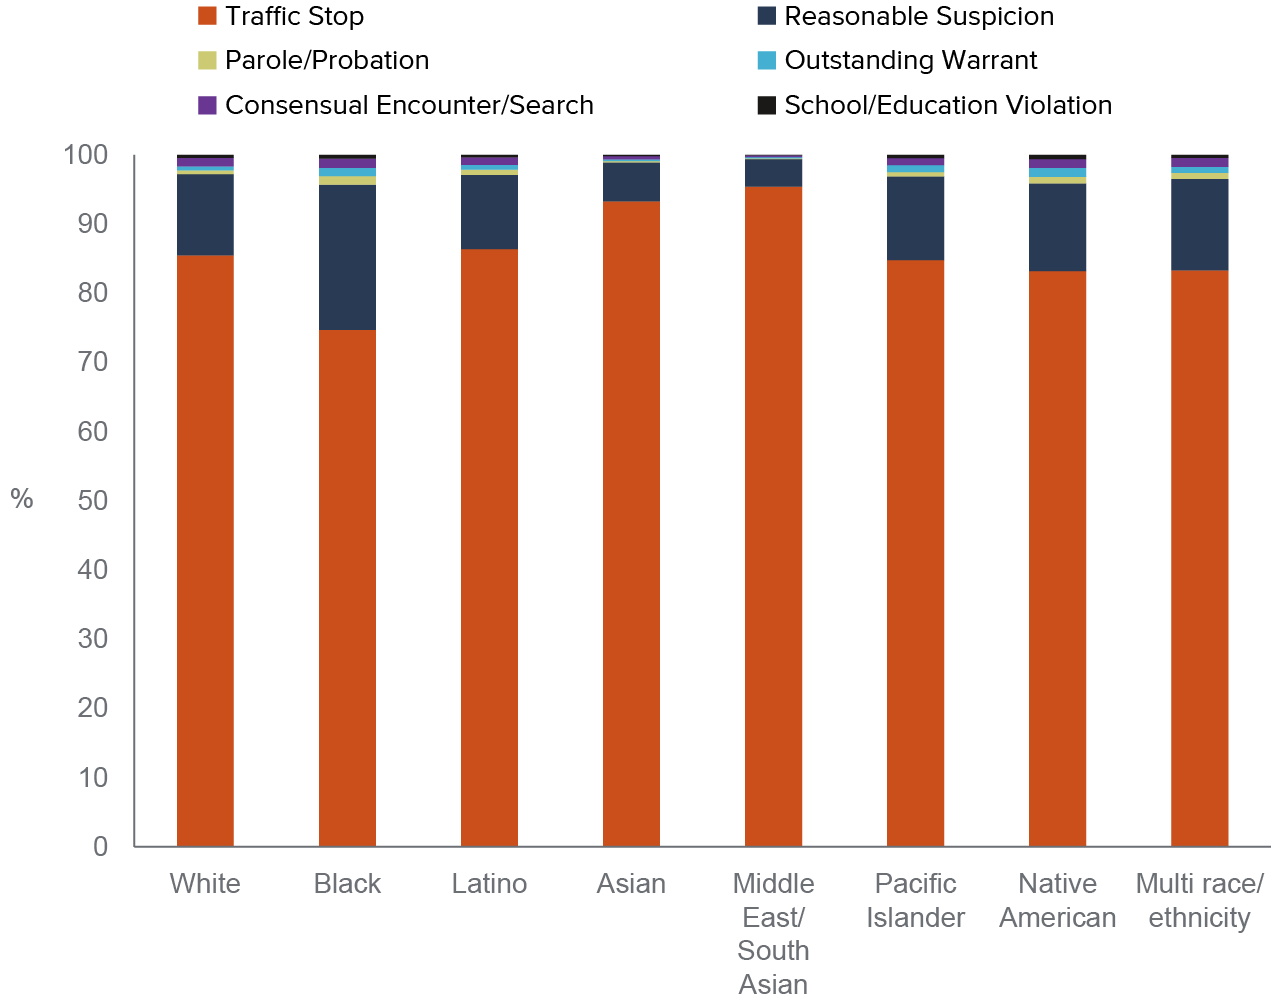
The data also reveal differences between reasons for stopping people of different races. For example, while more than 90 percent of stops of individuals perceived to be Asian or of Middle East/South Asian origin are stopped for traffic violations, about 75 percent of Black Californians stopped are for traffic violations (Figure 2). Conversely, officers report reasonable suspicion in 21 percent of stops of Black people, while 11.7 percent of white people and 5.6 percent of Asian people are stopped for reasonable suspicion.
While fewer stops involve individuals known by the officer to be on parole or probation or to have an outstanding warrant, their status provides officers with rights to stop and search without consent or reasonable suspicion. The percent of Black residents stopped who are on parole or probation is twice that of white residents (1.2% vs. 0.6%), and it is notably higher than Latino (0.8%) and Asian (0.2%) residents stopped as well.
The share of stops for an outstanding warrant is also twice as high for Black compared to white residents, also at 1.2 percent versus 0.6 percent. Technical Appendix Table A2 details differences across race and ethnicity in officer-perceived gender, age, mental health status, and whether the officer was responding to a call for services.
A greater share of Black people than white people are stopped for reasonable suspicion
SOURCE: Author calculations using California Department of Justice, Racial and Identity Profiling Act (RIPA) Wave 2 data, 2019.
Differences in Stop Experiences
A key way this report extends the 2021 RIPA Board report is by taking a closer look at racial disparities in the experiences and outcomes of individuals after they are stopped by law enforcement. More specifically, we analyze the following four stop outcomes:
- likelihood the individual stopped was searched;
- likelihood contraband or evidence (weapons, property, drugs or other, such as alcohol or cell phones) were found, if the person was searched;
- likelihood of enforcement, hierarchically defined below:
- at least a warning was issued;
- at least a citation (for an infraction, such as a speeding ticket) was issued;
- an arrest (cite and release or booked into jail); or
- booked into jail.
- likelihood of experiencing intrusive action or use of force, hierarchically defined below:
- at least asked to step out of the vehicle;
- at least some physical contact (such as removed from car);
- at least detained (curbside or patrol car);
- at least handcuffed;
- involved an officer’s weapon (such as aiming a firearm, but not necessarily firing the weapon); or
- officer weapon used (including use of firearm, electronic device, chemical spray, or baton).
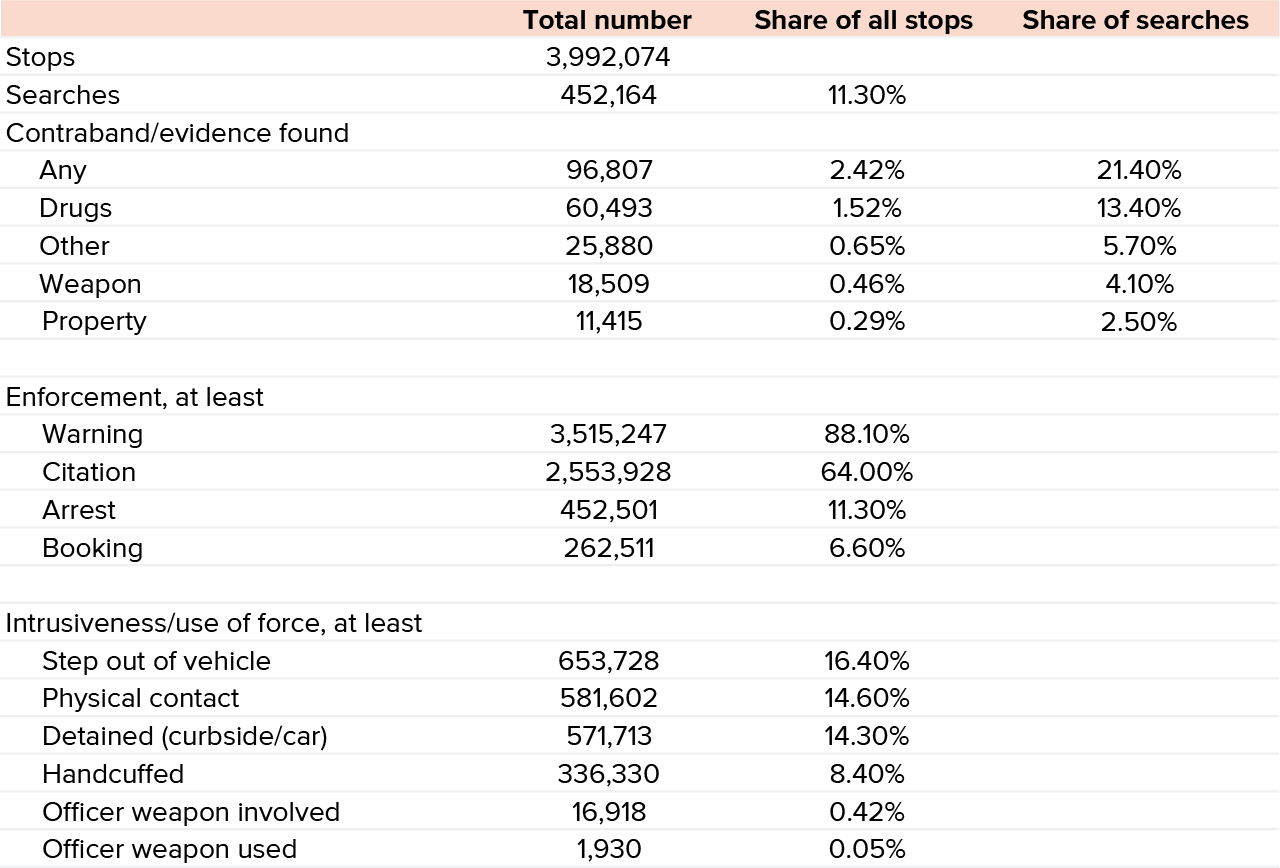
Of the almost 4 million reported stops in 2019, slightly more than 452,000 led to a person or property being searched. In close to 97,000 of those searches—about 21 percent—the officer found some contraband or evidence. That is, officers found contraband or evidence in about 2.4 percent of all police stops (Table 1).
The most common contraband was drugs or drug paraphernalia, found in a little more than 60,000 searches. The second most common category is other, which includes alcohol and cell phones (presumably evidence). In 18,507 searches, the officer found a weapon or ammunition. In more than 11,000 instances, the officer found property, which includes money that was either illegally held or was evidence.
In the vast majority of stops, about 88 percent, the officer issued at least a warning (Table 1). The officer issued at least a citation in 64 percent of all stops. Officers made an arrest—either a cite and release, or a booking—in 11 percent of stops, and booked over 6 percent of stopped individuals into jail.
While most stops led to some level of enforcement, intrusive actions were less common: for example, individuals were at least asked to step out of the vehicle in about one in six stops. Officers report some physical contact in over 14 percent of stops, most of which involved detaining a person curbside or in the patrol car.
In about 8 percent of stops, the person was at least being handcuffed. The percentage of stops that involved an officer’s weapon (which captures an officer pointing a firearm as well as when the officer uses the firearm or other weapon) is relatively small, at 0.42 percent. However, while the percentage is small, there are 16,918 stops where the officer reports that their weapon was involved. In 1,930 instances (0.05% of stops), the officer used a weapon— meaning the officer discharged a firearm or electric device such as a Taser, used a chemical spray or a baton, or a canine bit the stopped individual. The stop data do not capture whether anyone was injured as a result of the use of a weapon, or any other action taken during the stop.
Post-stop outcomes, all 15 law enforcement agencies, 2019
SOURCES: Authors calculations using California Department of Justice, Racial and Identity Profiling Act (RIPA) Wave 2 data, 2019.
Black Californians are notably overrepresented in police stops, and officers report reasons for stops that can vary across race and ethnicity, and across law enforcement agencies. We next consider the role of context of a stop, in an effort to better understand underlying factors to the patterns observed in outcomes.
Differences in Context of Stops
California passed the RIPA legislation in 2015 based on concerns about bias in policing that leads to different groups having different experiences with law enforcement. Beyond mandating collection of stop data, the legislation expanded and clarified the definition of racial and identity profiling to consider and rely on protected group status, such as race and ethnicity, in “… deciding which persons to subject to a stop or in deciding upon the scope or substance of law enforcement activities following a stop…”
Research consistently finds evidence of racial bias, explicit and/or implicit, broadly in society (see for example Bertrand and Mullainathan 2004; Bayer et al. 2017; Rothstein 2017; Avenancio-Leon and Howard 2019; Chetty et al. 2020; Kline, Rose, and Walters 2021). Furthermore, research has also found racial discrimination within the criminal justice system in jury, judge, and prosecutor decisions (Anwar, Bayer, and Hjalmarsson 2012; Arnold, Dobbie, Yang 2018; Sloan 2019). It is perhaps unsurprising that these racial biases extend to policing (Fryer 2019; Luh 2019; Hoekstra and Sloan 2020; Ba et al. 2021; Feigenberg and Miller 2021; Goncalves and Mello 2021), providing support to concerns historically raised by communities of color—concerns renewed in the wake of the killing of George Floyd.
Many factors contribute to whether an officer stops someone and to the officer’s subsequent actions. And while the RIPA data quite strongly point toward differences in stop outcomes across race and ethnicity (RIPA Board Report 2021), these differences may echo circumstances that do not reflect an individual officer’s bias. The reason and context for the stop likely influence an officer’s decisions and actions—for example, an officer may simply warn a driver stopped for speeding. Hence, differences in stop experiences between Black and white people may reflect differences in the reasons for the stop (Figure 2).
Independent of race and ethnicity, if an officer observed a person committing a crime, if a person has a warrant, or has a weapon, that person likely will be detained and searched, and possibly booked into jail after a stop. Such situations may be more adversarial—including the potential for use of force—than a traffic stop. If an individual is acting erratic, possibly due to behavioral health issues, an officer may shift decisions and actions. The prevalence of such situations across race and ethnicity may contribute to differences in outcomes.
Additionally, younger/inexperienced drivers may be more likely to violate traffic laws, and hence are plausibly more likely to be stopped than older and more experienced drivers. With men and adolescents/younger adults engaging in relatively more criminal activity, officers may place more scrutiny on younger men when they are stopped than on older individuals or women, independent of race/ethnicity (e.g., Ulmer and Steffensmeier 2014).
On average, Black Californians stopped by law enforcement are perceived to be younger compared to white Californians who are stopped (Technical Appendix Table A2). People stopped are also more often males. Relatively higher shares of Black persons are stopped for reasonable suspicion, outstanding warrant for an arrest, or mandatory supervision of a parolee/probationer. The latter two categories make a search more likely, as a warrant for a search is not needed, nor is cause, in California. Officers also report visibly seeing contraband in a higher share of stops of Black people than of white people.
Among the 15 largest law enforcement agencies, California Highway Patrol made more than 60 percent of all stops in 2019 of white individuals, but only about 35 percent of stops of Black individuals. And while Los Angeles Police Department (LAPD) accounts for almost 31 percent of stops of Black Californians, the agency made only 10 percent of stops of white Californians; partly reflecting that a higher share of the Los Angeles population is Black (about 8%) compared to statewide (about 6%). Agency-level differences in policing strategies, missions and roles, as well as officer behavior and biases, are also possible contributing factors.
Accounting for Differences in Personal Traits and Contexts
Differences in contexts, location, and agencies likely contribute to racial disparities in stop outcomes. Our goal here is to use regression models that adjust to account for differences across race/ethnic groups in such factors, and move us towards more “apples-to-apples” comparisons.
That is, we seek to compare stop outcomes across race/ethnicity for, say, individuals of the same age and gender, stopped for the same reasons by a given law enforcement agency. We also adjust for whether the officer reported seeing contraband, and whether the person had an outstanding warrant or is on parole or probation. (See Technical Appendix B for a detailed discussion of the analysis and regression model.)
These estimated differences in outcomes across race and ethnicity serve as a starting point for understanding how experiences with law enforcement differ for people of color compared to white people. We aim to provide a more complete picture of what the data tell us these differences look like. As we will show, the approach provides information on how contexts affect an officer’s actions and decisions, which may contribute to different experiences during a stop. Moreover, it also directs us towards contexts that deserve closer examination as particular sources of disparity.
Differences in Searches
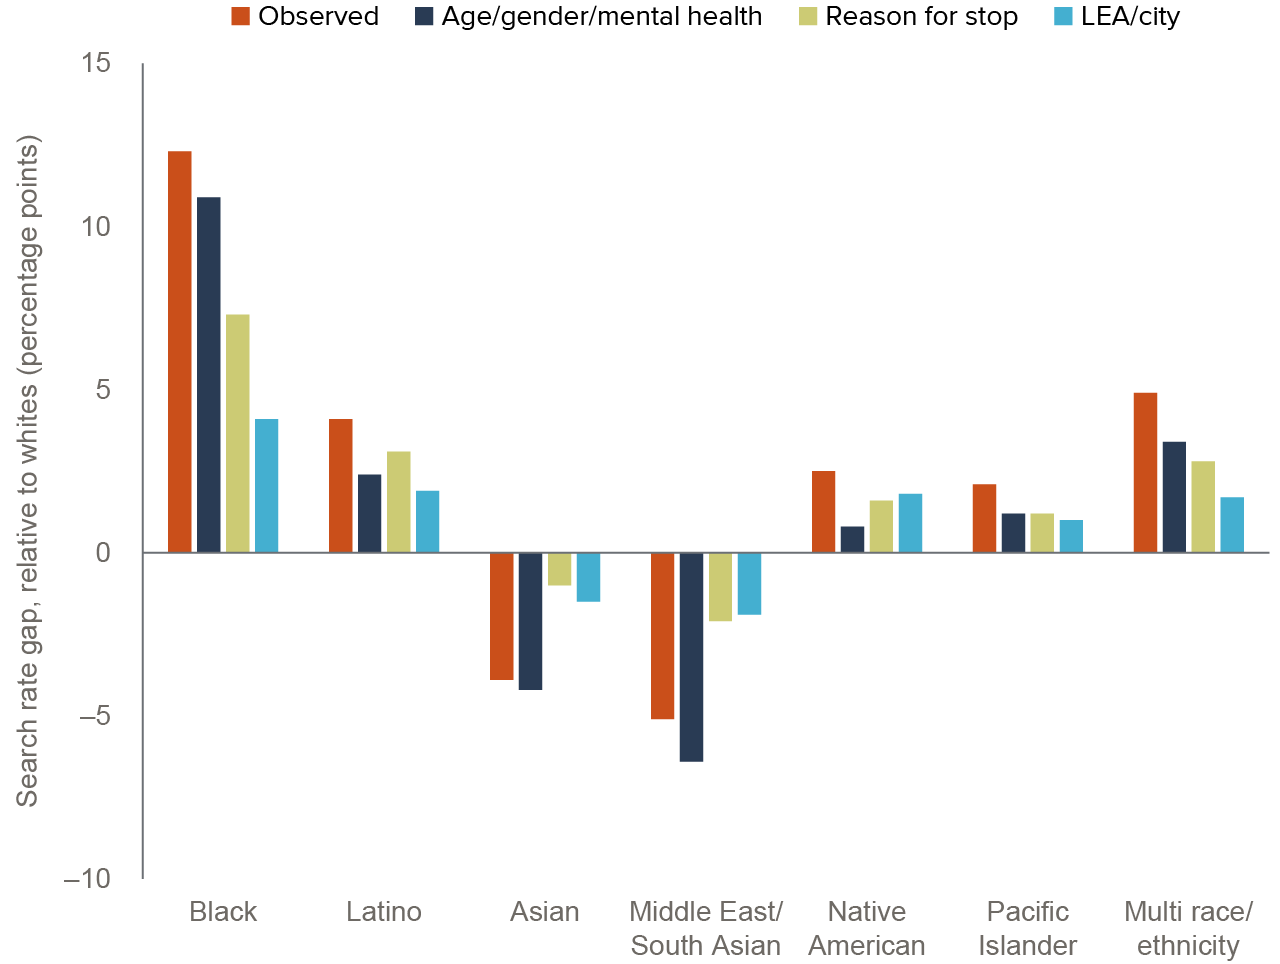
Over 10 percent of all stops involve a search of the person or property. For Black Californians the likelihood of being searched is more than twice that of white Californians—a search rate of 20.5 percent and 8.2 percent, respectively (Figure 3). The disparity between Black and white people stands out compared to all other race/ethnic groups; furthermore, individuals perceived to be Asian or of South Asian/Middle East origin are less likely to be searched than white individuals.
Black People Are More Likely than White to Be Searched, Partly due to Context of Stop
Focusing on the Black-white inequities, after we adjust for officer-perceived personal traits such as age, gender, and disabilities, the gap shrinks somewhat, to 10.9 percentage points (second columns in Figure 3). When we additionally adjust for differences in the reported reason for the stop, the gap in Black-white search rates drops to 7.2 percentage points (third columns in Figure 3).
This difference is driven by significantly higher search rates of individuals on parole/probation and with outstanding warrants compared to traffic violations, combined with more Black than white persons stopped for being on correctional supervision or having an outstanding warrant. Search rates vary notably across law enforcement agencies (see Technical Appendix Table A2), reflecting differences in factors such as mission of agencies (CHP vs. police department vs. sheriff’s departments), jurisdictional crime rates, and policing practices.
Furthermore, demographic characteristics differ across jurisdictions. For example, Los Angeles has a higher share of Black people than San Francisco, while San Francisco has a higher share of Asians than Los Angeles. If, for example, Black residents tend to live in cities where law enforcement may conduct searches more often across all racial and ethnic groups, then the Black-white disparity in search rates may partly reflect location.
When we adjust for average differences in search rate across law enforcement agencies and for fixed characteristics of a jurisdiction, the Black-white gap drops further to 4.1 percentage points. In other words, adjusting for perceived personal traits, context of stop, and location reduces the gap by about two-thirds. And while this suggests that these factors matter, we also find that Black people are still 1.5 times more likely to be searched during a stop than white people.
Disparities in searches narrow when adjusting for personal traits and context of stop
SOURCE: Author estimates using California Department of Justice, Racial and Identity Profiling Act (RIPA) Wave 2 data, 2019.
NOTES: The bars represent percentage point differences in the likelihood of being searched between white Californians and each of the racial/ethnic groups identified in the RIPA data. All estimates are statistically significant at the 95-percent confidence level. The stop data are limited to the state’s 15 largest law enforcement agencies (LEA): California Highway Patrol; the police departments of the cities of Los Angeles, San Diego, San Francisco, Fresno, Long Beach, Oakland, Sacramento, and San Jose; and the sheriff’s departments of Los Angeles, San Bernardino, Riverside, San Diego, Orange, and Sacramento Counties. Bars represent estimated gaps relative to white residents with consecutively added controls. Detailed regression results are presented in the Technical Appendix.
Contraband and Evidence Are Found Less in Searches of Black People than White
As a share of stops, contraband and evidence are found relatively rarely—in only about 2.4 percent of stops. So-called unconditional discovery or yield rates—the share of stops, as opposed to the share of searches, in which contraband or evidence was found—vary across perceived race and ethnic origin. For example, officers found some contraband and evidence in 4.4 percent of stops of Black persons, 2.5 percent with Latino persons, 1.8 percent with white persons, and 1 percent with Asian persons (Technical Appendix Table A7).
As a share of searches, contraband or evidence was found more often—in 21.4 percent of searches. The discovery rate, also known as conditional discovery or yield rate, varies little by race/ethnicity (Figure 4), from 19.3 percent for those perceived to be of South Asian/Middle Eastern origin to 23.9 percent for those perceived to be multi-race/ethnicity. Searches yield contraband or evidence in 0.6 percentage points fewer searches of Black people compared to searches of white people, or at rates of 21.6 percent and 22.2 percent, respectively.
The small Black-white gap increases as we control for personal traits and contexts reported by the officer. Officers are more likely to find contraband and evidence in searches of juveniles and young adults compared to older adults, and in searches of men compared to women—young men are represented more often in searches of Black individuals. Adjusting for perceived personal traits increases the gap to -0.8 percentage points, and adjusting for reason for the stop increases it to -1 percentage point.
The data also include information on the basis for the search, and searches most likely to yield contraband or evidence are searches when the officer reports either seeing or smelling (which includes canines) contraband or evidence. Officers more often report such basis for searches in stops of Black individuals than white (see Technical Appendix Table A2), which in turn means that when we adjust for the basis, the gap more than doubles to -2.3 percentage points. Put differently, officers discover contraband in their searches of Black people about 10 percent less than in searches of white people.
Adjusting for differences across law enforcement agencies does not appreciably change the Black-white gap in yield rates. Furthermore, when we break down contraband and evidence by separate categories (weapons, drugs, property, or other), the discovery rate gap is entirely driven by a lower likelihood of finding drugs in searches of Black than white Californians. The estimated gap, adjusted for all factors, is a statistically significant difference of -2.7 percentage points between the Black and white yield rate for drugs (Technical Appendix Table B5).
Contraband or evidence is found in fewer searches of Black and Latino individuals than of white individuals

SOURCE: Author estimates using California Department of Justice, Racial and Identity Profiling Act (RIPA) Wave 2 data, 2019.
NOTES: The bars represent percentage-point differences in the likelihood of discovering something while being searched between white Californians and each of the racial/ethnic groups identified in the RIPA data. All estimates are statistically significant at the 95-perent confidence level. The stop data are limited to the state’s 15 largest law enforcement agencies: California Highway Patrol, the police departments of the cities of Los Angeles, San Diego, San Francisco, Fresno, Long Beach, Oakland, Sacramento, and San Jose and the sheriff departments of Los Angeles, San Bernardino, Riverside, San Diego, Orange and Sacramento Counties.
Differences in Enforcement
Officers issue at least a warning in about 88 percent of all stops; thus, most stops lead to some enforcement. However, Black Californians are more likely to be stopped without any enforcement.
Black People Are Overrepresented in Stops with No Enforcement and with Arrests
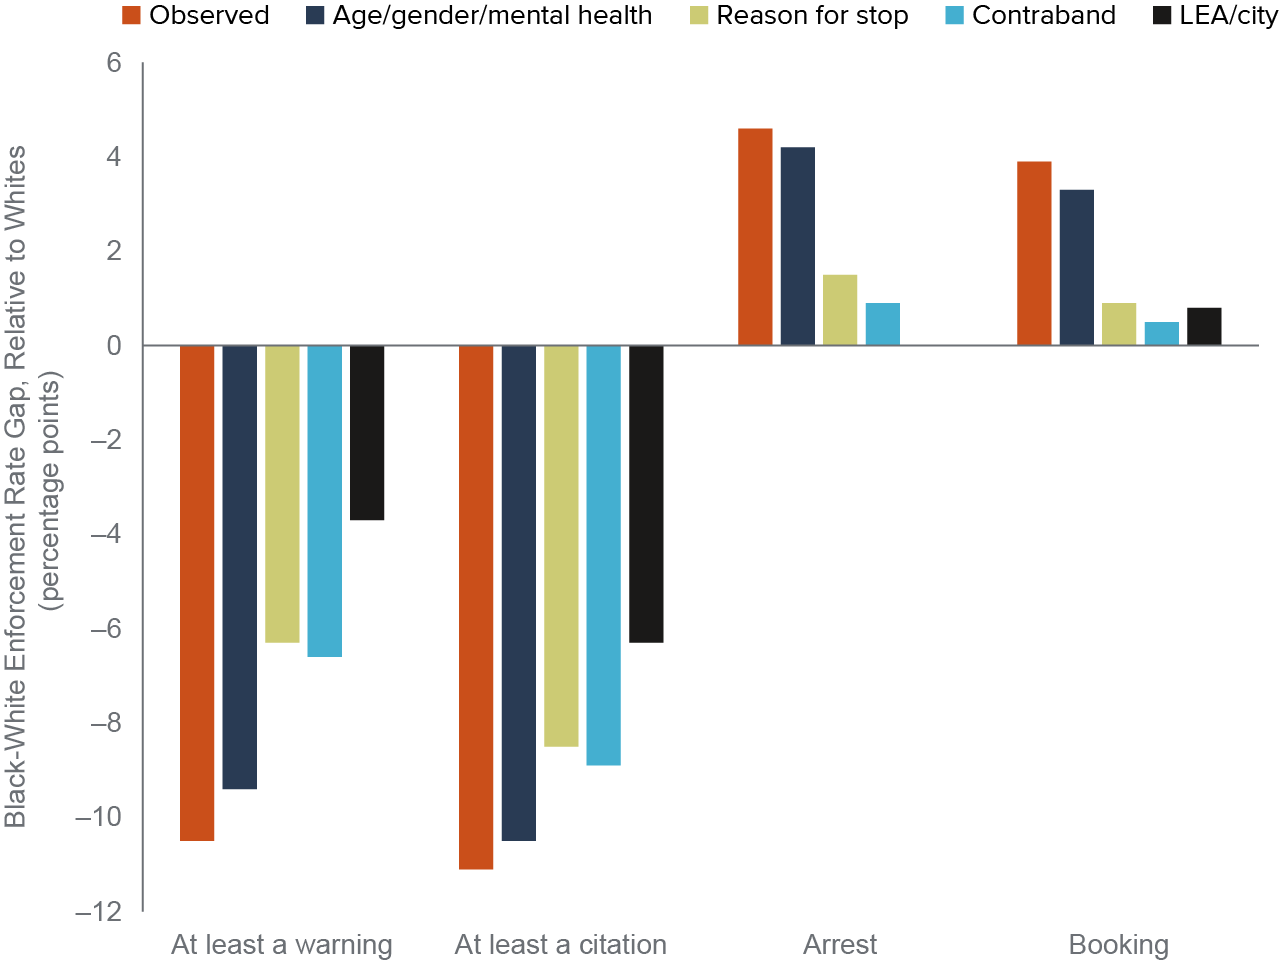
Officers issue at least a warning in fewer stops of Black persons compared to white, at 79.3 percent and 89.8 percent, respectively (Figure 5; also see Technical Appendix Table A11). Put differently, about one-fifth of stops of Black persons lead to no enforcement versus one-tenth of stops of white persons. The percentage-point gap is roughly the same if enforcement is at least a citation (53% and 64%, respectively).
However, stops of Black individuals are more likely to result in an arrest, at 9.5 percent of stops compared with 5.6 percent of stops of white individuals resulting in a jail booking. In other words, almost 1 in 10 Black people stopped are booked, while slightly more than 1 in 20 white people are.
Adjusting for perceived personal traits reduces the Black-white gaps somewhat, by about 1 percentage point for low enforcement and about half a percentage point for the highest enforcement. When we adjust for the reason for the stop, it reduces the estimated gaps notably: -6.3 percentage points for issuing at least a warning and 0.9 percentage points for likelihood of a booking (Figure 5). This is driven by more stops of Black people for reasons that do not lead to enforcement compared to white people, as well as high shares of booking, such as reasonable suspicion and parole/probation stops.
The drop in the gap around the likelihood of a booking is also partly due to most stops for an outstanding warrant lead to a booking (almost 70%), and Black Californians are overrepresented in stops for this reported reason. Lastly, when we adjust for enforcement rates across law enforcement agencies, the Black-white gap in the likelihood of the stop leading to at least a warning narrows notably (Figure 5). This shows that differences in enforcement rates are partly driven by more Black Californians than white Californians being stopped by law enforcement agencies that make more stops without enforcement. And while adjusting for all factors considered here lowers the observed gap notably, it also points towards widespread differences in enforcement across agencies.
Adjusting for stop context and enforcement rates across agencies reduces Black-white enforcement rates
SOURCE: Author estimates using California Department of Justice, Racial and Identity Profiling Act (RIPA) Wave 2 data, 2019.
NOTES: The bars represent percentage point differences in the likelihood of enforcement between whites and each of the racial/ethnic groups identified in the RIPA data. All estimates are statistically significant at the 95-percent confidence level. The stop data are limited to the state’s 15 largest law enforcement agencies: California Highway Patrol, the police departments of the cities of Los Angeles, San Diego, San Francisco, Fresno, Long Beach, Oakland, Sacramento, and San Jose and the sheriff departments of Los Angeles, San Bernardino, Riverside, San Diego, Orange, and Sacramento Counties.
Differences in Intrusive Actions
When law enforcement stops an individual, the interaction may be limited to verbal communication or it can widen to involve use of force and weapons. With the reported information captured by the data, we can create hierarchical variables of increasing levels of intrusiveness up to the level of an officer’s weapon being used.
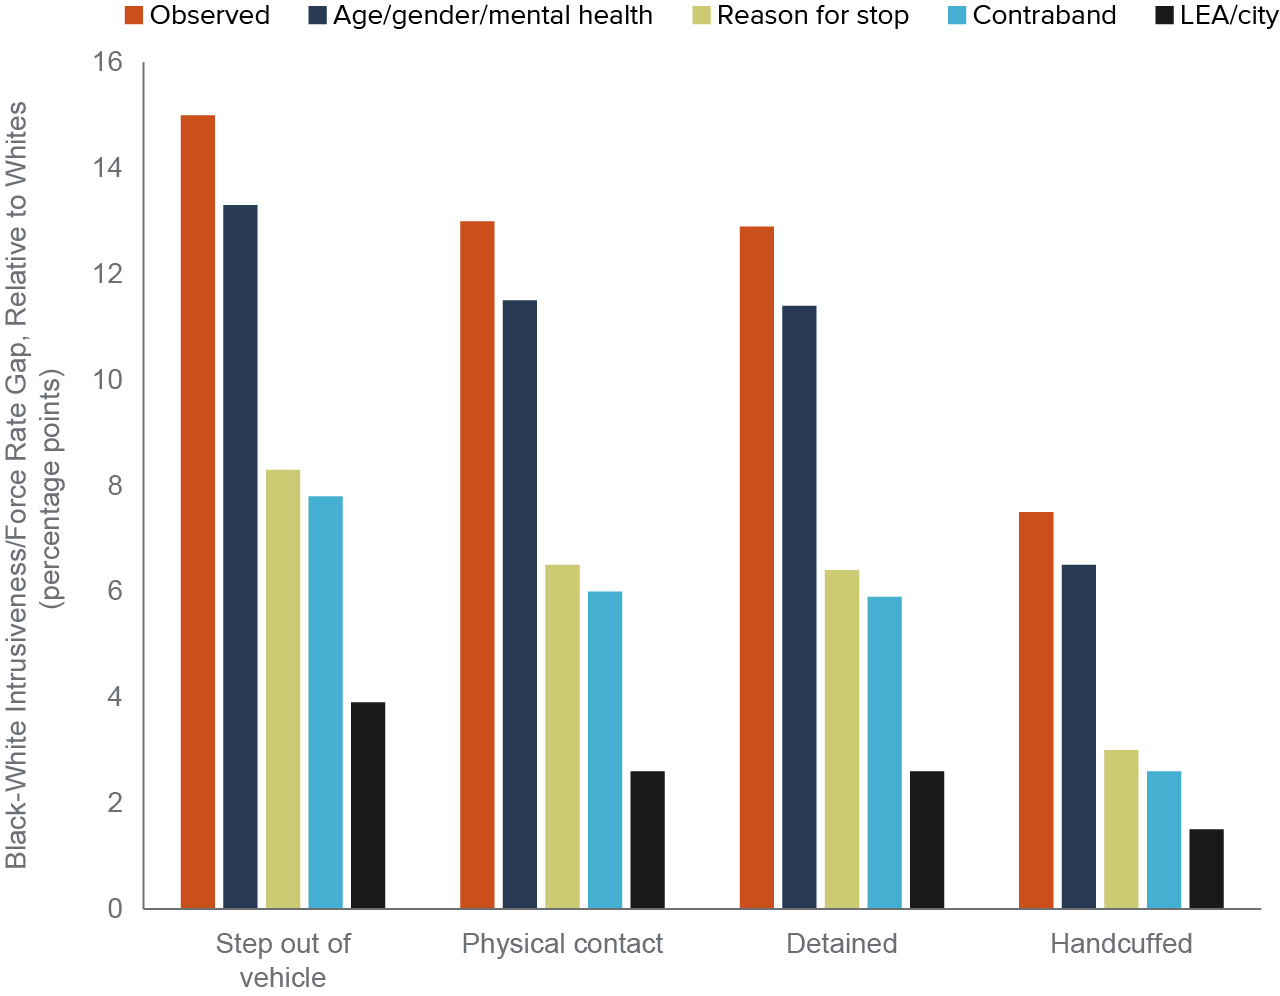
Black people Are More Likely than White to Experience Intrusive Actions
In 27.8 percent of stops of Black Californians, the officer asks the individual to step out of the vehicle or something more intrusive. For stops of Latino Californians, the share is 17.2 percent, while for stops of white and Asian Californians, the shares are 12.8 percent and 7.5 percent, respectively.
In other words, Black people are slightly more than twice as likely as white to at least be asked to step out of the vehicle. More generally, Black people are at least twice as likely as white people to experience each of the levels of intrusiveness defined here.
Adjusting for personal traits and context of the stop greatly reduces Black-white gaps in our measures of intrusiveness and use of force. While Black civilians are 7.5 percentage points more likely than white civilians to be at least handcuffed, that gap drops to 6.5 percentage points more when we adjust for personal traits (Figure 6). Adjusting for the reason for the stop shrinks the gap to 3 percentage points.
Furthermore, there is tremendous variation across law enforcement agencies in the race/ethnicity of individuals stopped and in the level of intrusiveness. For example, CHP makes about 60 percent of all stops of white Californians versus 35 percent of all stops of Black Californians (Technical Appendix Table A2). CHP also has the lowest share of stops where individuals are handcuffed, at 1.5 percent of all stops (Technical Appendix Table A5).
Therefore, when we adjust for differences across agencies, the Black-white gap related to handcuffing drops to 1.5 percentage points. In other words, for a Black person with otherwise the same personal traits as a white person, stopped for the same reason, by the same law enforcement agency, the likelihood of being handcuffed is one-fifth of the gap of 7.5 percentage points. Still, Black Californians are statistically significantly more likely to be handcuffed than white Californians, even after adjusting for the above factors—by 1.5 percentage points.
Black Californians are more likely than white Californians to experience greater intrusiveness
SOURCE: Author estimates using California Department of Justice, Racial and Identity Profiling Act (RIPA) Wave 2 data, 2019.
NOTES: The bars represent percentage point differences in the likelihood of the mentioned intrusive action between whites and each of the racial/ethnic groups identified in the RIPA data. All estimates are statistically significant at the 95-percent confidence level. The stop data are limited to the state’s 15 largest law enforcement agencies: California Highway Patrol, the police departments of the cities of Los Angeles, San Diego, San Francisco, Fresno, Long Beach, Oakland, Sacramento, and San Jose and the sheriff departments of Los Angeles, San Bernardino, Riverside, San Diego, Orange and Sacramento Counties.
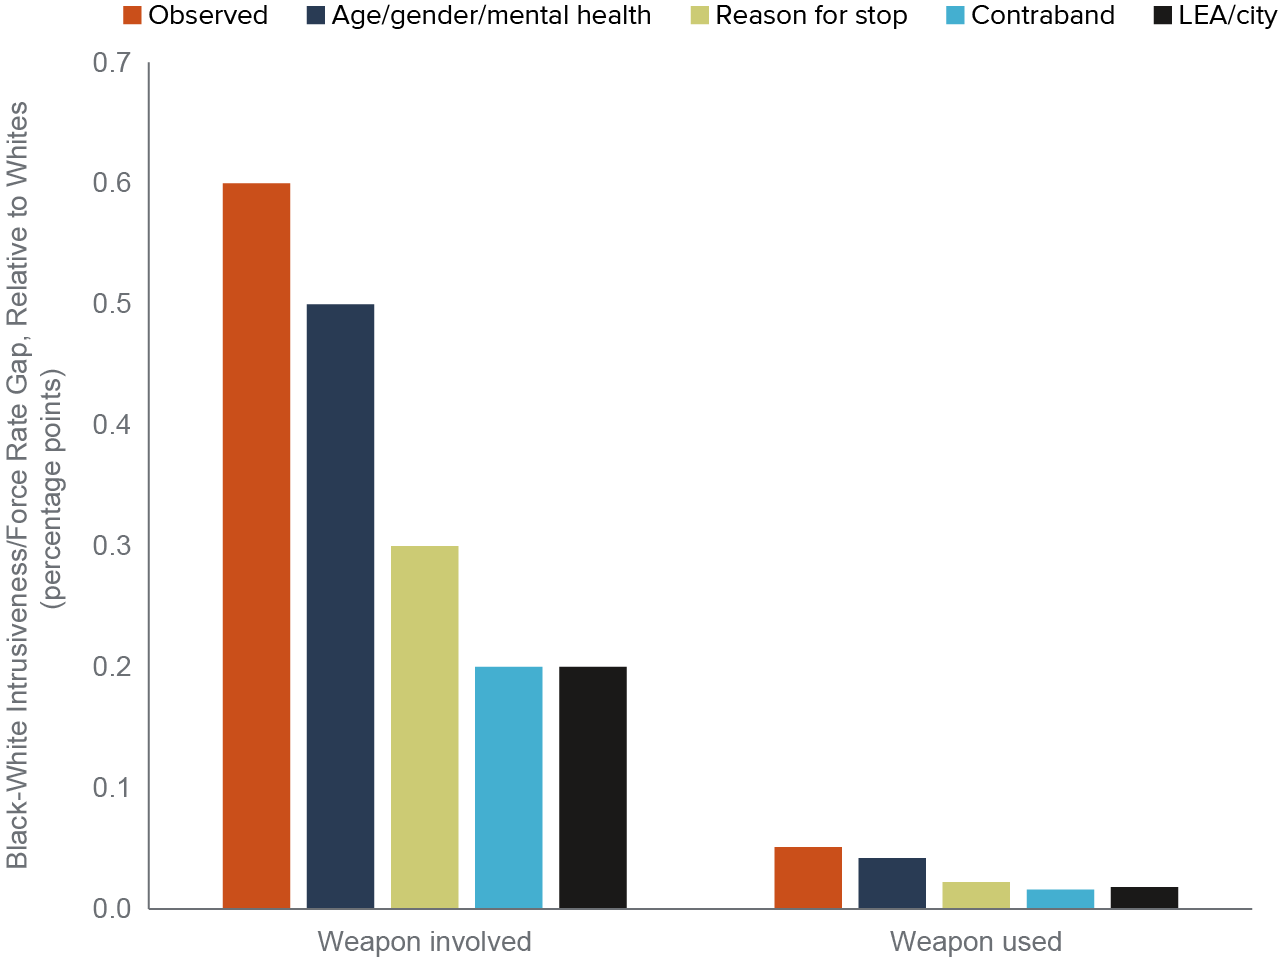
An Officer’s Weapon Is More Likely to Be Involved in Stops of Black People than White
Officers report that 16,918 out of the 3,992,074 stops (0.4%) involve an officer’s weapon. This includes an officer pointing a firearm at the individual (14,988 of all stops) as well as an officer’s weapon being used, which includes firearm, electric device such as a Taser, chemical spray, baton, or bitten by a canine (1,930 of all stops).
Stops of Black individuals are more likely to involve an officer’s weapon than stops of white individuals. But adjusting for differences in shares of stops where either a weapon is found, the stop is made for reasonable suspicion, or includes an individual with an outstanding warrant for an arrest reduces the Black-white gaps markedly.
Black Californians are roughly three times more likely than white Californians to experience a stop that involves a weapon, at about a 0.6 percentage point higher likelihood (Figure 7). Adjusting for personal traits—such as more young Black adults than white stopped—reduces the gap to about 0.5 percentage points. As stops based on reasonable suspicion—especially an outstanding warrant—are more likely to involve weapons than all other reasons for stops, and with Black individuals overrepresented in these categories, adjusting for such differences reduces the Black-white gap to 0.3 percentage points.
However, a weapon found during a search is most strongly associated with a stop involving an officer’s weapon, increasing the likelihood by almost 10 percentage points versus no contraband or evidence found. This adjustment reduces the Black-white gap to about 0.2 percentage points. While reported incidents of officers using a weapon are rare, the Black-white gap and patterns of adjustments are similar.
When a weapon is found a stop is more likely to involve an officer’s weapon
SOURCE: Author estimates using California Department of Justice, Racial and Identity Profiling Act (RIPA) Wave 2 data, 2019.
NOTES: The bars represent percentage point differences in the likelihood of having a weapon involved between whites and each of the racial/ethnic groups identified in the RIPA data. All estimates are statistically significant at the 95-percent confidence level. The stop data are limited to the state’s 15 largest law enforcement agencies: California Highway Patrol, the police departments of the cities of Los Angeles, San Diego, San Francisco, Fresno, Long Beach, Oakland, Sacramento, and San Jose and the sheriff departments of Los Angeles, San Bernardino, Riverside, San Diego, Orange and Sacramento Counties.
Differences in Agency Stops
Are racial disparities in outcomes greater in traffic stops than in stops for reasonable suspicion—the two most common reasons for stops? Do they differ across agency type? To answer these questions, we examine Black-white differences in outcomes separately by reason for stop and agency: the statewide California Highway Patrol compared to local law enforcement (that is, police and sheriff’s departments).
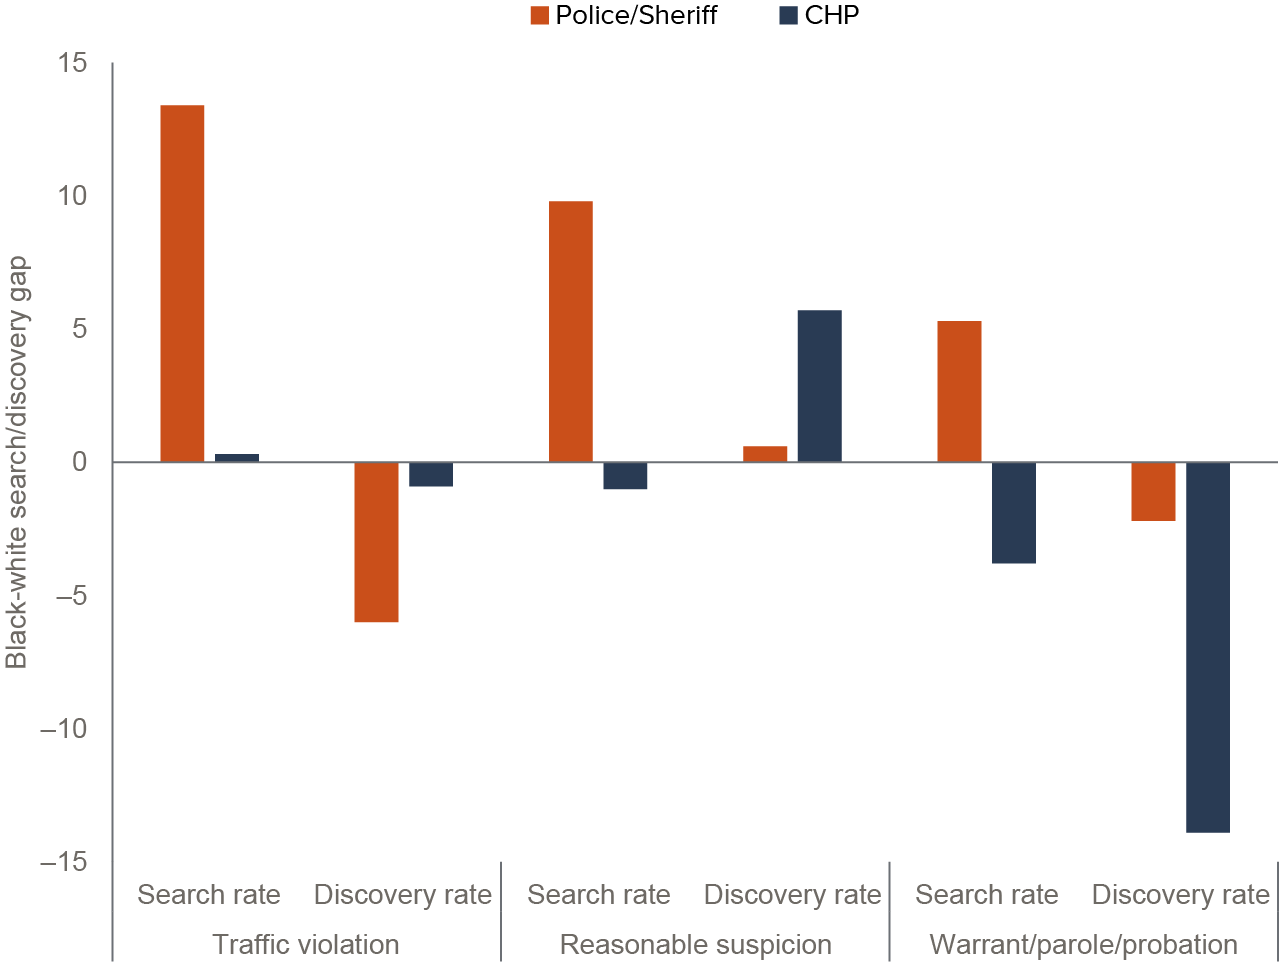
Traffic Stops by Police and Sheriff’s Departments Show Greatest Disparities
Generally, traffic stops have the greatest Black-white disparities, especially among local law enforcement agencies. Roughly two-thirds of traffic stops are for moving violations, while about one-third are for equipment and non-moving violations; in these traffic stops, more than three times the share of Black Californians than white Californians are then searched by police and sheriff departments (Figure 8; Technical Appendix Table A10).
CHP traffic stops rarely result in a search, and the Black-white disparity is notably less; Black drivers are searched at a rate of 1.5 percent of stops, and white drivers are searched at a rate of 1.2 percent. While search rates are much higher in stops for reasonable suspicion, for individuals with a warrant, or for someone on parole/probation, the disparity is much less. This is true whether the stop is made by local law enforcement agencies or CHP, but for those types of CHP stops, search rates of Black people are even lower than for stops of white people.
When drivers are searched during stops for traffic violations, the search is less likely to yield contraband or evidence than when the stop is for reasonable suspicion, outstanding warrant, or known parole/probation, especially in the relatively rare searches in CHP stops.
However, when local law enforcement agencies search white Californians during traffic stops, the yield rate is somewhat higher than during stops for reasonable suspicion, outstanding warrant, or parole/probation. The Black-white gap for yield rate is notable: some contraband is found in 25.1 percent of searches of white people and in 19.1 percent of searches of Black people. Both local and statewide agencies report higher yield rates for Black than white Californians when stopping for reasonable suspicion.
Traffic stops by local law enforcement show higher Black-white gaps for searches and discovery rates
SOURCE: Author estimates using California Department of Justice, Racial and Identity Profiling Act (RIPA) Wave 2 data, 2019.
NOTES: The bars represent percentage point differences in the likelihood of enforcement between whites and each of the racial/ethnic groups identified in the RIPA data. All estimates are statistically significant at the 95-percent confidence level. The stop data are limited to the state’s 15 largest law enforcement agencies: California Highway Patrol, the police departments of the cities of Los Angeles, San Diego, San Francisco, Fresno, Long Beach, Oakland, Sacramento, and San Jose and the sheriff departments of Los Angeles, San Bernardino, Riverside, San Diego, Orange and Sacramento Counties.
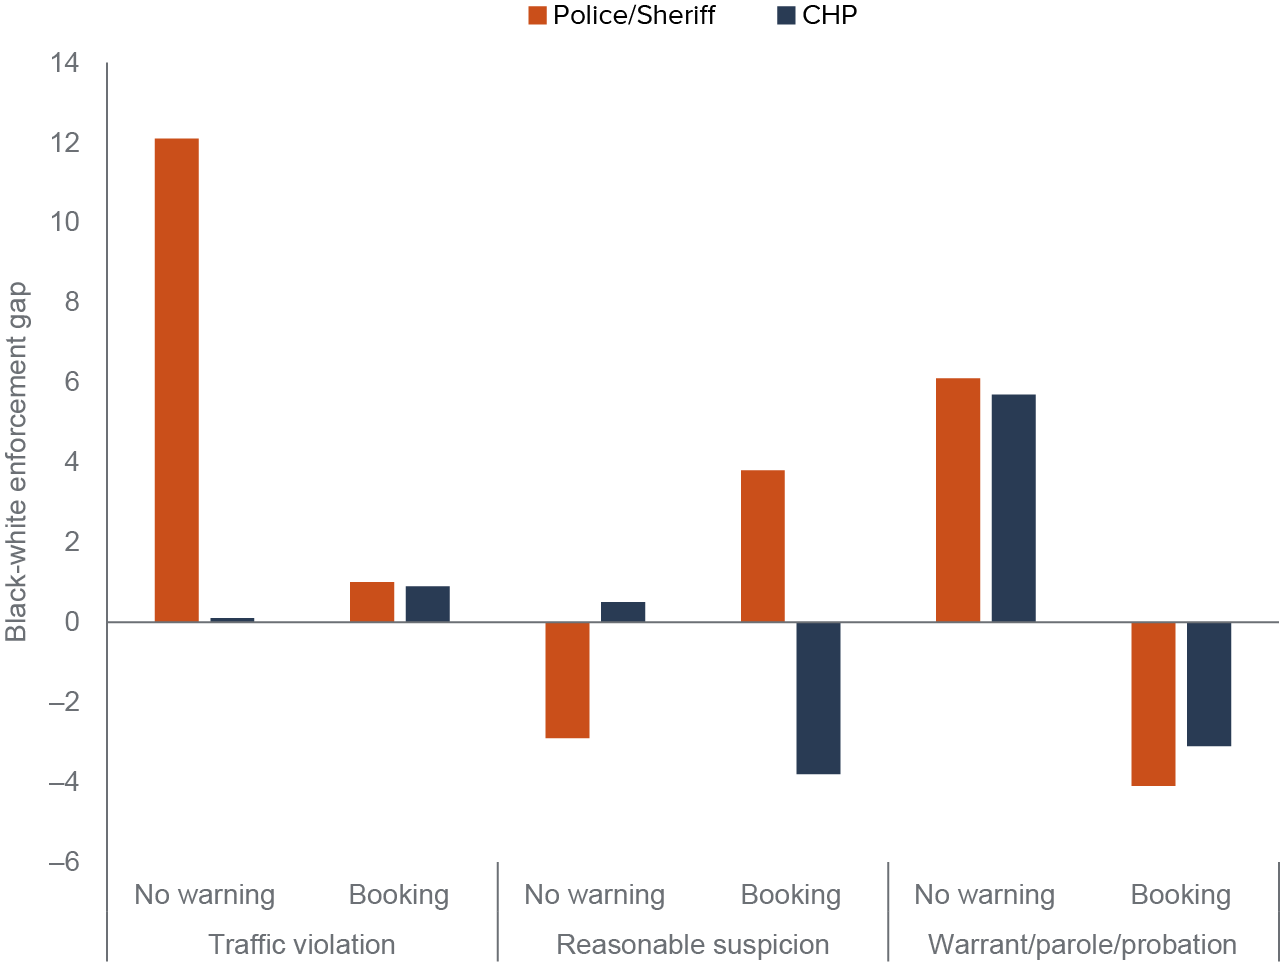
When police and sheriff departments make stops for traffic violations, a higher share of Black drivers are stopped without the officer issuing a warning compared to white drivers (Figure 9): 23.3 percent and 11.2 percent, respectively. In CHP stops for traffic violations, almost everyone, Black or white, receives at least a warning, 98.5 percent and 98.6 percent, respectively. While being stopped for a traffic violation rarely results in a booking, both state and local law enforcement agencies book Black drivers more often than white, about 3.5 percent and 2.5 percent respectively.
Black-white gaps for no-enforcement and booking are greatest among local law enforcement agencies
SOURCE: Author estimates using California Department of Justice, Racial and Identity Profiling Act (RIPA) Wave 2 data, 2019.
NOTES: The bars represent percentage point differences in the likelihood of enforcement between whites and each of the racial/ethnic groups identified in the RIPA data. All estimates are statistically significant at the 95-percent confidence level. The stop data are limited to the state’s 15 largest law enforcement agencies: California Highway Patrol, the police departments of the cities of Los Angeles, San Diego, San Francisco, Fresno, Long Beach, Oakland, Sacramento, and San Jose and the sheriff departments of Los Angeles, San Bernardino, Riverside, San Diego, Orange and Sacramento Counties.
Furthermore, when local law enforcement agencies make stops for traffic violations, Black drivers are more likely to experience more intrusive actions that white drivers. For example, in 8.6 percent of these stops by the 14 police and sheriff’s departments, Black drivers were handcuffed compared to 3.5 percent of white drivers. For CHP, the shares were 1.5 percent and 1.1 percent, respectively.
Traffic stops that involve an officer’s weapon are very unusual, but Blacks are overrepresented in those instances (0.17% and 0.05% of traffic stops for Black and white drivers, respectively). Stops made for reasonable suspicion or of individuals with a warrant or on parole/probation are markedly more likely to involve a weapon than traffic stops, and also more likely in stops of Blacks than whites. For example, when local law enforcement agencies stop for reasonable suspicion, interactions involve a weapon in almost twice the share of stops of Blacks compared to whites, 2.9 percent and 1.5 percent, respectively (for CHP stops for reasonable suspicion, the shares are 2.4% for Blacks and 1.6% for whites).
Given the notable differences between CHP and the local law enforcement agencies, and the type of stop, we also estimated regression models restricted to traffic stops separately for statewide and local law enforcement agencies (results shown in Technical Appendix Tables B17–B21). Broadly, the results show that the estimated Black-white gaps in the post-stop experiences in traffic stops made by police and sheriff departments are much less sensitive to inclusion of demographics and the contextual factors included in our analysis. In other words, the notable disparity discussed above remains, and additionally, fully adjusted Black-white gaps in traffic stops made by CHP are substantially smaller. Black-white disparities in the likelihood of being booked, however, are not appreciably smaller for CHP traffic stops than for those made by local law enforcement agencies, and are greater once we adjust for all of the factors.
Conclusion
Our analysis of the 2019 RIPA data, which includes nearly 4 million stops from the 15 largest law enforcement agencies in California, reveals notable differences across race/ethnicity in experiences with law enforcement during a stop, differences that significantly stem from context of the stop, agency and jurisdiction characteristics, and personal civilian traits. However, even after adjusting for these factors, stark racial disparities persist—particularly between Black and white civilians—and may represent a conservative estimate of racial bias.
Black Californians are significantly more likely to be stopped than white Californians, and experiences during stops and outcomes afterward also vary. We find that Black individuals are more than twice as likely to be searched as white individuals. Overall, searches yield some kind of contraband or evidence in slightly more than one-fifth of searches.
Black people are also overrepresented among stops not leading to enforcement as well as in those leading to an arrest. The seemingly contradictory pattern is partly due to a higher share of Black people stopped for reasonable suspicion, having an outstanding warrant, or being on parole/probation—contexts where stops are investigatory and do not lead to any enforcement, or they are more serious and may result in a booking.
The lower share of searches yielding contraband and higher shares of stops without enforcement suggest such practices may be inefficient. Similarly, experiences during a stop are more intrusive for Black individuals than white, even when we adjust for differences in contexts.
We also find that Black people are at least twice as likely as whites to experience so-called intrusive outcomes, ranging from being asked to step out of a vehicle, to being handcuffed, to the stop involving a weapon. While relatively rare, officers report that in about 0.4 percent of stops involve an officer’s weapon. Stops of Black individuals, however, are three times more likely to involve a weapon than stops of white individuals. Accounting for context reduces the disparity, but stops of Black Californians are almost twice as likely to involve an officer’s weapon as stops of white Californians.
These racial inequities persist despite adjusting for context, providing empirical support for concerns historically voiced by communities of color. However, context around a stop does explain part of the observed racial gap. Differences in context—such as whether a person was stopped because of a traffic violation versus an outstanding arrest warrant—expose officers to varying risk levels when interacting with the community. Law enforcement might examine whether traffic stops in particular can be reduced without leading to any negative impact on public safety.
While traffic stops are intended to make our streets and highways safer to travel on, they represent the majority of stops and interactions between officers and citizens, generating many of the inequities discussed in the report around experiences with a stop. This focus holds particular relevance for police and sheriff departments, where more than one-third of traffic stops are for an equipment or non-moving violation (e.g., expired registration or overly tinted windows). By reducing these stops, law enforcement could mitigate some of the racially disparate experiences communities of color face, as well as reduce the risk of injury present for both officers and individuals.
Topics
Criminal Justice PopulationLearn More
How Often Are Firearms Confiscated During Traffic Stops?
Law Enforcement Staffing in California
Police Use of Force and Misconduct in California
Police Use of Force and Racial Disparities during Traffic Stops
Racial Disparities in Traffic Stops