To address data collection challenges and a shifting policy environment, this year’s California Poverty Measure estimates poverty levels as of fall 2021.
Poverty in California fell nearly 5 points between 2019 and fall 2021.
- The poverty rate dropped from 16.4% in 2019 to a projected 11.7% in fall 2021, according to the California Poverty Measure (CPM)—a research effort by PPIC and the Stanford Center on Poverty and Inequality that accounts for housing costs and safety net benefits. About 4.5 million Californians remain under the CPM poverty line (about $36,900 yearly for a family of four).
- Child poverty plunged from 17.6% in 2019 to 9.0% in fall 2021.
- Social safety net programs are primarily responsible for the large declines. Both the federal Child Tax Credit (CTC) and CalFresh food assistance increased benefits and expanded eligibility in response to COVID-19. Official poverty, which does not reflect the role of these programs, increased from 10.5% in 2019 to 11.6%.
- The 2021 expansion of the CTC has expired, so poverty has likely increased in 2022.
More than a quarter of Californians are living in or near poverty.
- In fall 2021, 28.7% of residents were poor or near poor, down from 34.0% in 2019.
- The rate of Californians who were near poor (with resources up to one and a half times the CPM poverty line) fell slightly, from 17.6% in 2019 to 17.0% in 2021.
- Deep poverty—the share of families with less than half the resources to meet basic needs—fell from 4.6% in 2019 to 3.3%.
Without social safety net programs, more Californians would live in poverty.
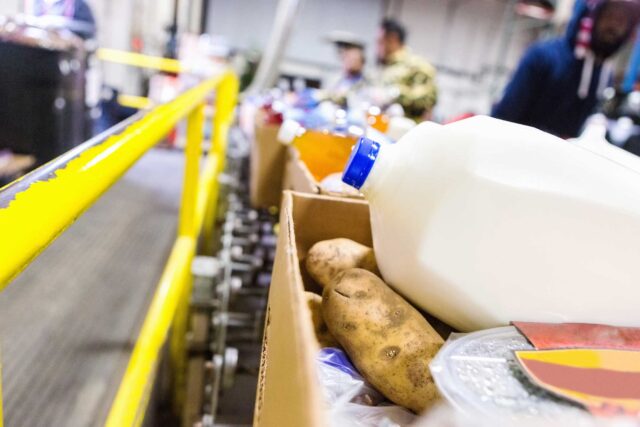
- In fall 2021, about 3.9 million more Californians (10.3%), would have been in poverty without safety net programs. CalFresh kept 1 million Californians out of poverty (2.6%), up from 500,000 in 2019, due to both temporary and ongoing changes. Through temporary monthly payments to families with children, the federal CTC lowered poverty by 1.8 points; the federal Earned Income Tax Credit lowered poverty by 1.1 points.
- Most safety net programs prioritize children—and in fall 2021 these programs kept 19.7% of children (about 1.7 million) out of poverty.
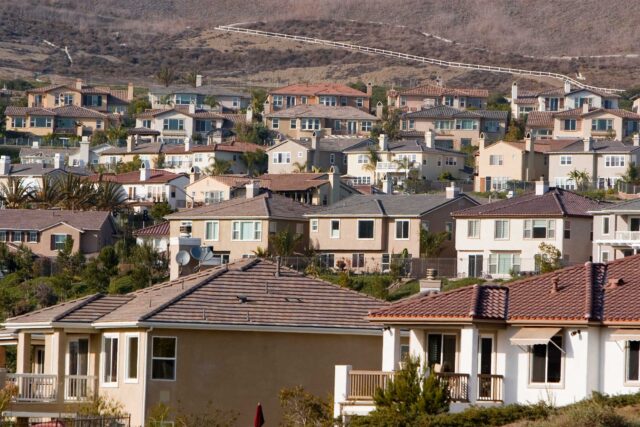
- Poverty rates vary widely across the state. Los Angeles (13.7%) and Orange (13.1%) Counties had the highest poverty rates; the Central Valley and Sierra region had the lowest (9.3%), largely due to lower housing costs. Across legislative districts, rates differ greatly (5.0% to 21.2%).
- Safety net programs reduce poverty most in inland areas: without them, poverty would be 15.2 points higher in the Central Valley and Sierra regions, but only 5.7 points higher in the Bay Area.
Poverty was highest among seniors, Latinos, and less-educated adults.
- In fall 2021, poverty was markedly higher for adults 65 and older (16.3%) than for children (9.0%) and adults 18–64 (11.6%)—a reversal from previous years, when child poverty was highest.
- Though the Latino poverty rate has fallen to 13.5% (from 21.4% in 2019), Latinos remain disproportionately poor—comprising 45.7% of poor Californians, but 39.7% of all Californians. About 12.6% of African Americans, 11.8% of Asian Americans/Pacific Islanders, and 9.9% of whites lived in poverty.
- The poverty rate for immigrant Californians was 16.1%, compared to 10.0% for US-born; poverty among undocumented immigrants was 25.1%.
- Education continues to be tied to poverty rates: 6.2% of college graduates age 25–64 and 19.5% of adults age 25–64 without a high school diploma live in poverty. Nonetheless, poverty fell 9.6 points since 2019 among less-educated adults.
Most poor families in California are working.
- In fall 2021, nearly two-thirds (64.2%) of poor Californians lived in families with at least one working adult, excluding families with only adults 65 and older.
- For 34.7% of those in poverty, at least one family member reported working full-time for the entire year; for 29.5%, a family member worked part-time and/or part of the year.