
California’s overall arrest rate was historically low in 2021.
- Law enforcement agencies in California reported roughly 793,000 total arrests in 2021. This translates to a historically low arrest rate: 2,014 arrests per 100,000 residents.
- Arrest rates have dropped dramatically over the past few decades. The overall arrest rate peaked at 6,757 arrests per 100,000 residents in 1989 (nearly 2 million reported arrests) and then fell precipitously throughout the 1990s.
- The steady decline since 2006 in the overall arrest rate has been driven by a drop in arrests for misdemeanor offenses and a reduction in arrests of juveniles and young adults.
Arrest rates have declined steadily since the early 1990s and were at historic lows in 2021
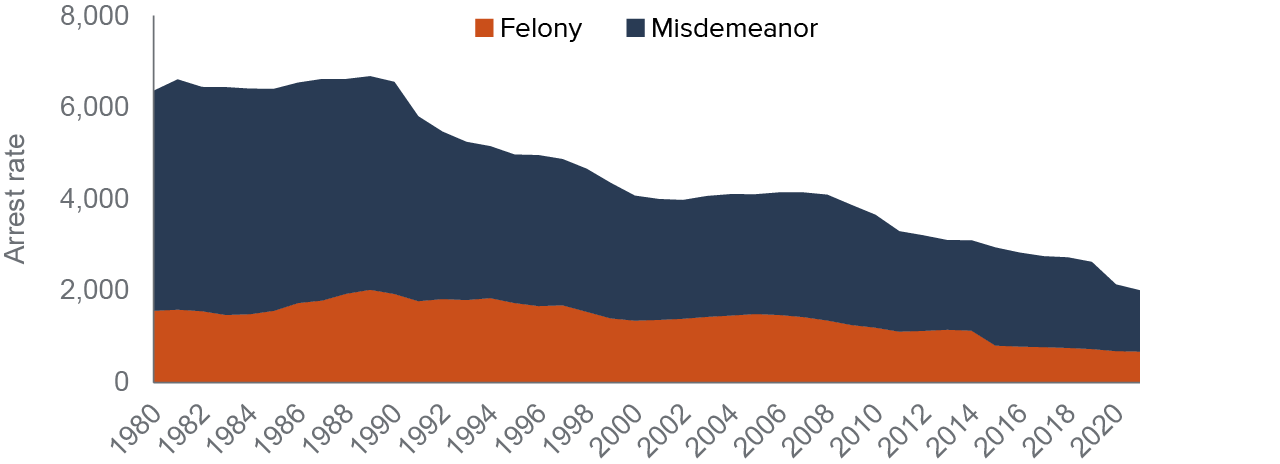
SOURCE: Authors’ calculation based on California Department of Justice’s Open Justice Arrests dataset and California Department of Finance Population Data, 1980–2021.
NOTE: Arrest rates are the number of arrests per 100,000 residents, not age-adjusted.
Arrest rates for misdemeanors dropped significantly during the pandemic.
- The overall arrest rate dropped by nearly 19% from 2019 to 2020, and fell an additional 6% from 2020 to 2021.
- While the felony arrest rate has declined by almost 8% since 2019, the misdemeanor arrest rate saw a notable 30% decline.
- Public health concerns led to fewer social interactions during the pandemic, plausibly contributing to decreases in some types of crime. Californians limited their public movement, and many local law enforcement departments directed officers to avoid arrests and bookings for lower-level offenses to reduce the number of people entering county jails and to limit officers’ and citizens’ exposure to COVID-19.
More than a third of felony arrests are for violent offenses.
- Nearly 267,000 felony arrests were made in 2021.
- Violent offenses were the largest category of felony arrests (35.1%), followed by property crimes (21.8%); 8.9% of felony arrests were for drug offenses.
- Weapons-related offenses accounted for 9.7% of felony arrests. This is one of just a few categories (including driving under the influence and arson) to make up a larger share of felony arrests in 2021 than in 2020.
Drug offenses are the largest category of misdemeanor arrests.
- About 525,000 misdemeanor arrests were made in 2021.
- About one in four (25.3%) misdemeanor arrests were for drug offenses. Driving under the influence and battery/assault made up 20.1% and 12.2% of all misdemeanor arrests, respectively.
- Alcohol-related offenses accounted for 7% of misdemeanor arrests, and offenses related to burglary, petty theft, or misuse of checks accounted for 3.8%.
Racial disparities in arrest rates have lessened over time but remain significant.
- The rise and fall of arrest rates over the past several decades have been especially marked among Black Californians.
- In 1980, the adult arrest rate for Black Californians was 15,273 per 100,000 residents, compared to 8,524 among Latinos and 5,225 among whites.
- The Black arrest rate peaked in 1989 at 18,853 per 100,000 residents. In 2021, the Black arrest rate had dropped by 13,536, to 5,317 per 100,000 residents, 72% below its peak.
- In 2021, the Latino arrest rate was 2,253, and the white arrest rate was 1,737. Since 1989, these rates have declined 74% (or by 6,485 per 100,000) and 65% (or by 3,293 per 100,000).
Racial disparities in arrests were less extreme but still significant in 2021
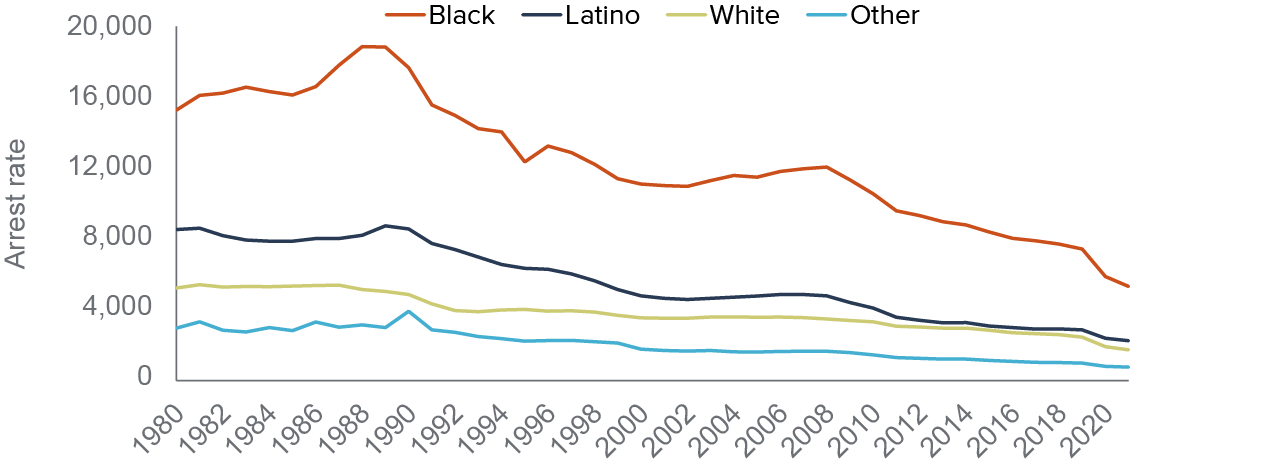
SOURCE: Authors’ calculation based on California Department of Justice’s Open Justice Arrests dataset and California Department of Finance Population Data, 1980–2021.
NOTE: Arrest rates are the number of arrests per 100,000 residents, not age-adjusted.
Men are arrested at a substantially higher rate than women, but the gap has narrowed.
- The male arrest rate in 2021 was 3,109 per 100,000—more than three times the female arrest rate of 864.
- This gender gap has narrowed notably over the past few decades. In 1980, the male arrest rate was more than six times the female rate (11,258 and 1,850, respectively). Since then, the female share of arrests has grown from 14.5% to 21.8%.
- The narrowing gender gap is driven largely by a drop in male misdemeanor arrests. The male misdemeanor arrest rate declined from 8,336 per 100,000 residents in 1980 to 2,022 per 100,000 residents in 2021.
- While the male violent arrest rate has declined from 659 in 1980 to 367 in 2021, the female violent arrest rate rose from 72 in 1980 to 103 in 2021.
Smaller, rural counties tend to have higher arrest rates than larger, urban counties.
- Rural counties in 2021 had an arrest rate of 3,293 per 100,000 residents, while urban counties had an arrest rate of 1,954 per 100,000 residents.
- Colusa (5,214), Shasta (5,038), Del Norte (4,706), and Tuolumne (4,562) had the highest arrest rates in the state. Rates in these mostly rural counties were more than three times as high as the lowest county rates: San Diego (998), San Francisco (1,080), and Contra Costa (1,448).
- Many factors, including crime rates, economic and demographic differences, and law enforcement policies, could be driving this variation.