
Table of Contents
- Key Takeaways
- Introduction
- How Has State Facility Funding Been Distributed in California?
- Which Students and Districts Have Benefitted Most—and Least?
- SFP Allocation within Districts Has Been More Equitable
- Policy Implications and Recommendations
- Notes and References
- Authors and Acknowledgments
- PPIC Board of Directors
- Copyright
Key Takeaways
California’s K–12 school facilities require significant new and ongoing investments. Funding for facilities comes mostly from local sources, and depends crucially on local property wealth. The state provides some funding for facilities through the School Facility Program (SFP), which usually requires local matching contributions. Does the SFP promote a more equitable distribution of school capital funding? This report finds:
- SFP funding has disproportionately benefitted more affluent students and districts. Low-income, English Learner (EL), and Latino students have received less funding than higher-income, non-EL, and white students since 1998. Per student state funding has been highest in the districts with the fewest high-need students. →
- Disparities are driven largely by modernization funding—and partially addressed by hardship funding. Higher-wealth and lower-need districts have received more funding for modernization, one of three major SFP programs. Funding for new construction, a second major program, goes mainly to growing districts; it has been higher in lower-wealth districts, but also in districts with fewer high-need students. Funding for both financial and facility-based hardship—the third major program—has been significant enough for higher-need and lower-wealth students and districts to partially address disparities. →
- Suburban districts have received the most SFP funding, while funding for rural districts has been “boom or bust.” Suburban districts received the most funding per pupil and are the least likely to have received no funding at all. Most districts that have received no SFP funding are rural. However, higher levels of hardship funding have kept average per student state funding in rural districts comparable to funding per student in cities and towns. →
- Districts allocate funding across schools in ways that reduce inequities across districts. Districts target more funding to schools with higher shares of low-income and Latino students. However, within-district allocations generally have a small impact on across-district disparities. This suggests that focusing on which districts receive funding may be more impactful than efforts to influence which schools within districts are targeted for facility improvements. →
- State policies could improve the equity and efficiency of facilities funding. Recently proposed changes—including a sliding scale for district contributions keyed to local wealth and/or need, prioritization of facility needs, and greater funding for hardship cases—could help narrow funding inequities. To make it easier for small districts with lower organizational and fiscal capacity to qualify for and receive funding, county offices of education and/or the California Department of Education could provide greater technical assistance. Finally, improving current data on facility conditions would go a long way toward accurately assessing needs and targeting the schools and districts with the greatest need. →
Introduction
California’s school buildings require continued investments to meet current and projected need arising from aging school facilities, changes in educational programs, and compliance with federal and state regulations. Evidence suggests that many students in California attend schools that are in substandard condition. In 2018–19, 38 percent of students attended schools that did not meet minimum facility standards, with 15 percent in schools with at least one extreme deficiency such as a gas leak or structural damage. Between 2015–16 and 2018–19, 108 schools across 60 districts had to close temporarily due to poor facility conditions (Gao and Lafortune 2020). About 30 percent of schools were built more than 50 years ago and roughly 10 percent were built more than 70 years ago (Vincent 2012).
Estimates suggest California needs to spend $3.1 to $4.1 billion annually at both state and local levels to maintain school facilities—and more than $100 billion in the coming decade after including modernization and new construction costs (Brunner and Vincent 2018). A recent report by the state auditor estimates that the state will need to provide $7.4 billion in funding to meet existing and anticipated needs over the next five years (California State Auditor 2022).
The COVID-19 pandemic brought additional facility costs: schools need additional resources for construction and renovation projects to improve ventilation and maintain safe operations (Centers for Disease Control and Prevention 2020; California Department of Public Health 2021). So, too, has the implementation of California’s latest initiatives, including expanding transitional kindergarten, community schools, and continued use of technology to support teaching and learning.
The Local Control Funding Formula (LCFF) funds most operational spending, and it is keyed to the shares of low-income students, English Learners, and foster/homeless youth in each district. The majority of capital funding however, comes from local tax revenues, which vary considerably across districts. This raises concerns that differences in local property wealth drive inequities in capital funding across districts. State funding for capital projects has the potential to address disparities in wealth. However, the School Facility Program (SFP)—California’s primary vehicle for funding school facility projects—allocates funds on a first-come, first-served basis. Moreover, SFP funding is generated from general obligation bonds, which must be approved by voters. California voters have approved five bonds to fund the program: Proposition 1A ($6.7 billion) in 1998, Proposition 47 ($11.4 billion) in 2002, Proposition 55 ($10 billion) in 2004, Proposition 1D ($7.3 billion) in 2006, and Proposition 51 ($7 billion) in 2016. In 2020, voters rejected Proposition 13, which would have provided $15 billion funding to the SFP. Two new bonds (Assembly Bill 75 and Senate Bill 22) are now pending in the legislature.
The SFP was established by the Leroy F. Greene School Facilities Act of 1998 to provide matching grants for school districts to acquire school sites, construct new facilities, and modernize existing facilities. New construction grants provide funding on a 50/50 state and local match basis; and modernization grants provide funding on a 60/40 basis. Districts fund their shares primarily through local general obligation bonds and developer fees (levied by school districts on most forms of new development). Districts that cannot cover all or part of their share of costs for an SFP project may also receive financial hardship assistance. Under limited circumstances (such as natural disasters or severe health and safety threats), school districts can get additional state funding through facility hardship grants.
Previous studies of school facility funding have found wide disparities across California districts between 2007 and 2015 (Vincent and Jain 2015; Brunner and Vincent 2018; Brunner, Schwegman, and Vincent 2021). Little is known about how funding is distributed within districts or the extent to which these investments have addressed substandard conditions in many of the state’s K–12 public schools. The differences across districts suggest that distributions under the SFP for the last quarter-century have been regressive with respect to student need, which runs counter to the LCFF’s rationale and approach.
Building on prior research, this report examines the distribution and equity of SFP school facility spending across and within districts from 1998 to 2021—the entire span of the program. We rely on SFP project audits maintained by the Department of General Services. We built a simple web scraper in Python to automatically download more than 11,000 facility projects from 1998 to 2021. We merged SFP data with the California Department of Education’s administrative data on school demographics, enrollment, and student outcomes from 1998 to 2021. District assessed value—a measure of local property wealth—is based on the 2018–19 assessment. Finally, we drew from the Facility Inspection Tool (FIT) data included in the 2018–19 School Accountability Report Card (SARC) to determine the condition of district facilities. See Technical Appendix A for a more detailed description of data sources.
We begin by examining historical trends in SFP funding and then look at differences in SFP funding across districts and student demographics. Next, we calculate how much certain student groups are targeted by facility improvements within districts. We estimate the relationship between SFP funding and current facility conditions, examining differences in the level and timing of funding across school sites in the same district that ever received SFP funding. We conclude with a brief discussion of policy implications and recommendations.
How Has State Facility Funding Been Distributed in California?
The changes to California’s system of school facility finance over the years—together with broader economic and demographic trends—resulted in dramatic variation in school facility funding (Brunner 2007). Annual per pupil funding plummeted from over $800 in the early 1960s to less than $200 in early 1980s, before recovering in the late 1990s. After the creation of the School Facility Program, per pupil funding increased sharply, to more than $1,400 in 2005. But California’s facility spending remained below the national average until 2000, and it consistently spent less on school facilities than other states with similar enrollment trends (Colorado, Florida, New Jersey, Texas, and Washington).
The earlier statewide bonds funding the SFP were larger in both nominal and real terms, and as a result funding was greatest for SFP projects completed from 2005–15 (see Technical Appendix Figures B1 and B2 for information on funding levels by project completion year). Spending peaked at more than $5.2 billion in 2006–07, with $3.4 billion funded through state bond proceeds. SFP project spending fell during the recession, recovered in 2012–13 and 2013–14, and has since fallen to its lowest levels since 2000. The state’s share of SFP project spending has decreased over time, from 80 percent in the 1990s to 62 percent in 2017, though it has been slightly higher in the last few years. As a result, the state share of capital spending for K–12 schools in California was only 16 percent in 2018–19 (Filardo 2021). Thus, the ability of the SFP to affect the overall inequities in capital spending across districts may be limited.
The SFP includes three major funding categories: modernization, new construction, and site acquisition (see Technical Appendix Table A2 for a list of all project funding types, by total amount since 1998). In the program’s first decade (1998–2007), modernization was the single largest category, constituting nearly 60 percent of SFP funding. Modernization funding fell significantly during and after the Great Recession, before bouncing back slightly in recent years. New construction funding has been higher than modernization funding since the Great Recession. Notably, hardship funding— an additional funding category provided to districts with a demonstrated financial or facility hardship need—represents a small share of total SFP state funding (11%) and an even smaller share of total SFP project spending (7%), with less than $300 million in all but three years since 1998.
Which Students and Districts Have Benefitted Most—and Least?
While the SFP has invested tens of billions of dollars to help districts maintain and improve their capital stock, prior studies have found large inequities in the distribution of school facility funding across districts (Brunner 2007; Brunner and Vincent 2018, Brunner, Schwegman, and Vincent 2021).
Given the importance of local funding, it is not surprising that capital spending has been highest in the districts with the highest property wealth for most of the past two decades (Technical Appendix Figure B3). In most other states, state funding for capital reduces spending gaps between the most and least affluent districts (Biasi, Lafortune, and Schönholzer 2021). However, SFP’s first-come, first-served funding tends to favor large and affluent districts, which are better able to apply quickly for grants (Legislative Analyst’s Office 2015; California State Auditor 2022).
In this section we consider the entirety of SFP funding from 1998 to 2021. To better understand the equity implications of state capital funding, we compare these spending levels across districts with different demographic characteristics.
Low-Income Students and English Learners Have Received Less Funding
We first compare funding across student groups, in per student terms, focusing on district enrollment by student income, race/ethnicity, and English Learner status upon project completion. For example, how much funding has been directed to the average low-income student (via their district) through the SFP, since its inception? Figures 1 and 2 report these differences, calculated using district-level SFP funding data.
First, there is a notable gap in funding between low-income and higher-income students, i.e., students who are eligible for free/reduced-price lunch and those who are not. Counting both state- and district-level funding, the districts attended by the typical low-income student spent roughly $860 less per student on SFP-funded projects since 1998 (Figure 1). Notably, one-third of this gap is driven by state-level funding. State funding is 6 percent lower for the average low-income student than for the average higher-income student. In other words, state SFP funding appears to exacerbate differences in capital spending due to differences in local property wealth.
We can also identify significant racial disparities in SFP project spending. Overall, the average white student received over $800 more in total SFP project spending than the average Latino student, and nearly $700 more than the average Black student.
Low-income students and English Learners received less SFP funding
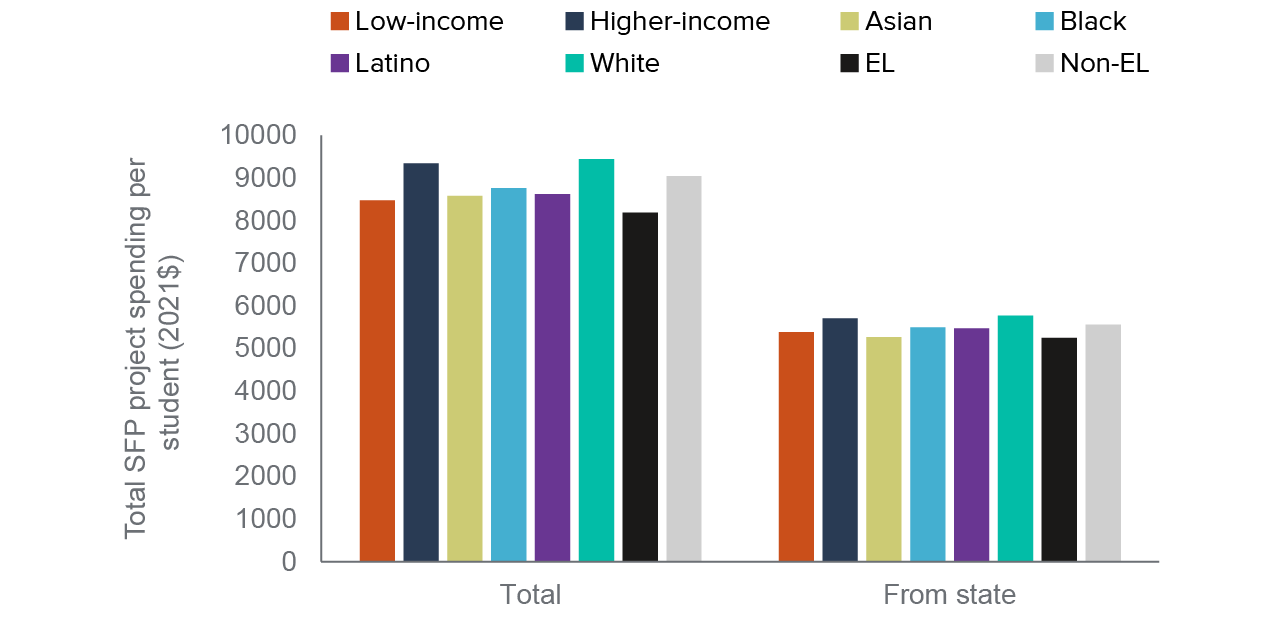
SOURCES: Department of General Services, 1998 – 2021; California Department of Education, 1998 – 2021.
NOTES: Averages are weighted by student subgroup enrollment in the district at the time of the final report upon completion. District-level totals are computed in per pupil terms, using district enrollment in the year of project final report. Funding amounts are inflation-adjusted to 2021 dollars using the CPI-U. See Technical Appendix A for further details.
Figure 2 focuses specifically on the three largest SFP funding categories: modernization, new construction, and facility and financial hardship. Disparities are largest for modernization funding: low-income students received $330 less per student, or 17 percent less than higher-income students; Black and Latino students received about 18 percent less than white students. For new construction funding, gaps are generally smaller: funding levels for Black and Latino students are about 7 percent lower than for white students. Notably, Asian students received the highest levels of modernization funding, but the lowest levels of new construction funding.
Disparities are greatest for modernization funding and hardship funding
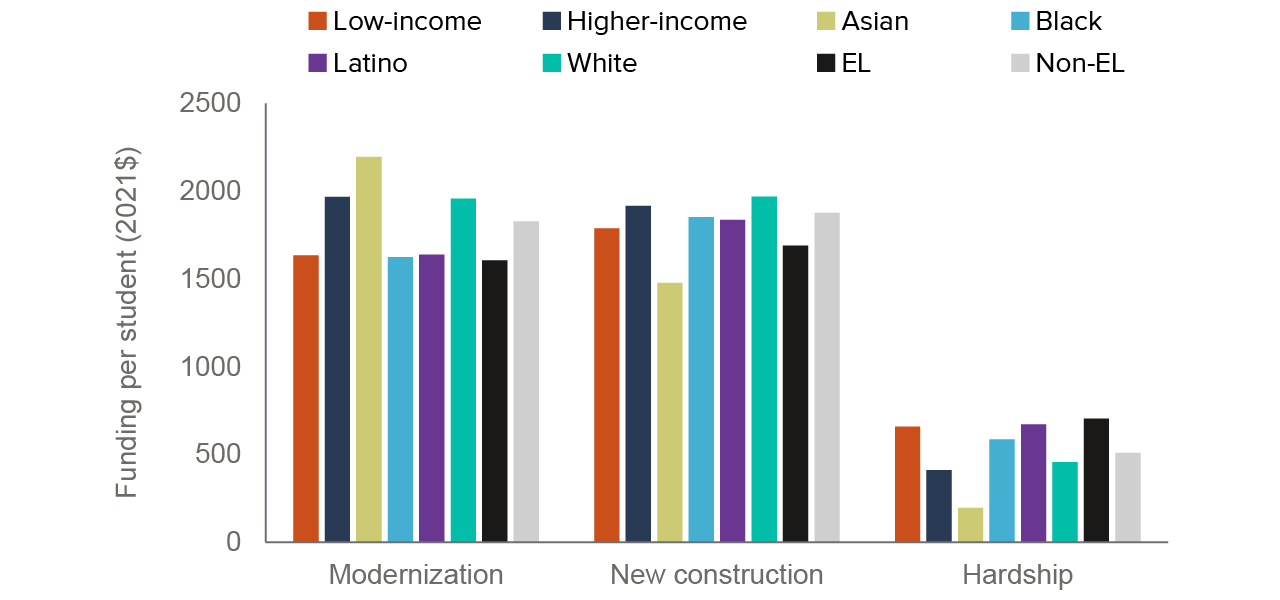
SOURCES: DGS SFP Project Audit Records; California Department of Education; authors’ calculations.
NOTES: Averages are weighted by student subgroup enrollment in the district at the time of the final report upon completion. District-level totals are computed in per pupil terms, using district enrollment in the year of project final report. Modernization funding includes 50-year modernization grants. Hardship funding includes facility and financial hardship categories. Funding amounts are inflation-adjusted to 2021 dollars using the CPI-U. See Appendix A for further details.
Also striking is the disparity between English Learner (EL) and non-EL students. Total SFP project spending was roughly $850 less for the average EL compared the average non-EL student ($8,188 vs. $9,046). When considering only state funding, the typical EL student received $300 (5.5%) less since 1998. Lower funding for EL students holds for both modernization (12%) and new construction (10%). EL students are in districts that received higher levels of hardship funding, but this difference compensated for only half of the disparity in modernization and new construction funding.
Lower-Wealth, Higher-Need Districts Received Less Modernization Funding per Student
Next, we compare funding across districts based on assessed property values, shares of high-need students (used in LCFF allocations), enrollment levels and growth, and locales. Because we do not have readily available data on some district characteristics—such as assessed value and the share of high-need students—for all years of the SFP, we rely on demographics measured in the 2019–20 school year. To facilitate comparisons across districts of different sizes, we report amounts in dollars per student, based on enrollment in 2019–20. In other words, we ask: How much more or less SFP investment have districts with differing characteristics today received since 1998, per current student?
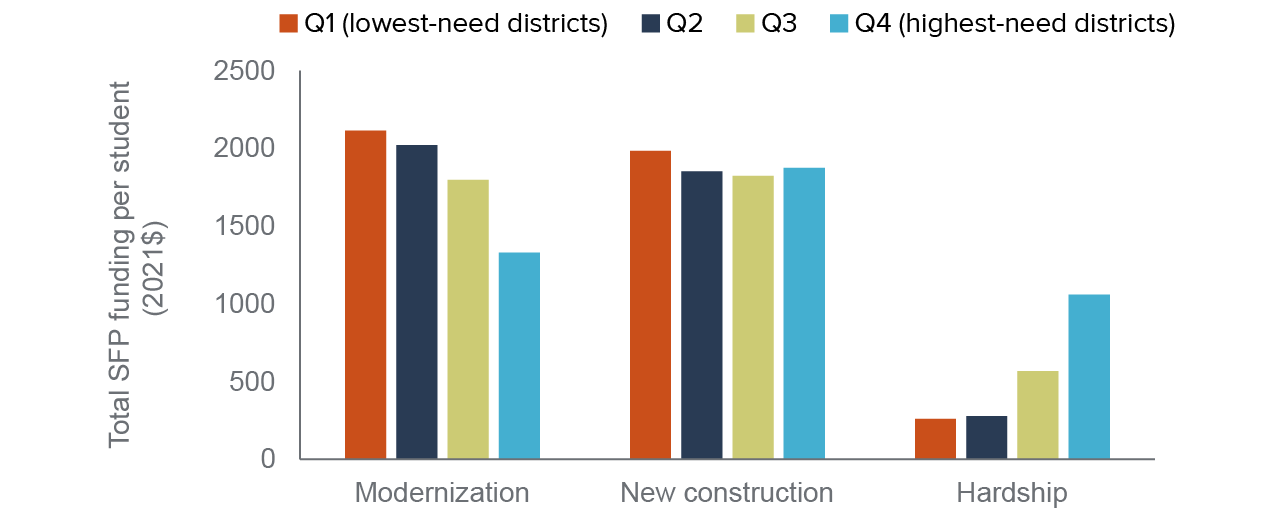
Figure 3 shows the SFP program funding separately for modernization, new construction, and hardship funding. Here, districts are divided according to the quartile of property wealth (defined here as assessed property value per pupil). Districts in the first quartile (“Q1”) have the lowest assessed property wealth per pupil, while those in the fourth quartile (Q4) have the highest.
Students in low-wealth districts attend schools that have received $1,500 (nearly 60%) less in SFP modernization funding than those in high-wealth districts since 1998. Conversely, new construction funding is much higher—by about $1,000 per student—in the lowest-wealth districts. Hardship funding is a notable source for the lowest-wealth districts—at roughly $1,400 per student—while it makes up a very small share of SFP funding in higher-wealth districts ($400 or less per student). In sum, total funding from both state and district sources for SFP projects is higher in the highest-wealth districts, though state funding is more equitably distributed across districts of varying wealth (Appendix Figure B4).
Modernization funding is highest for high-wealth districts, while low-wealth districts have received more new construction and hardship funding
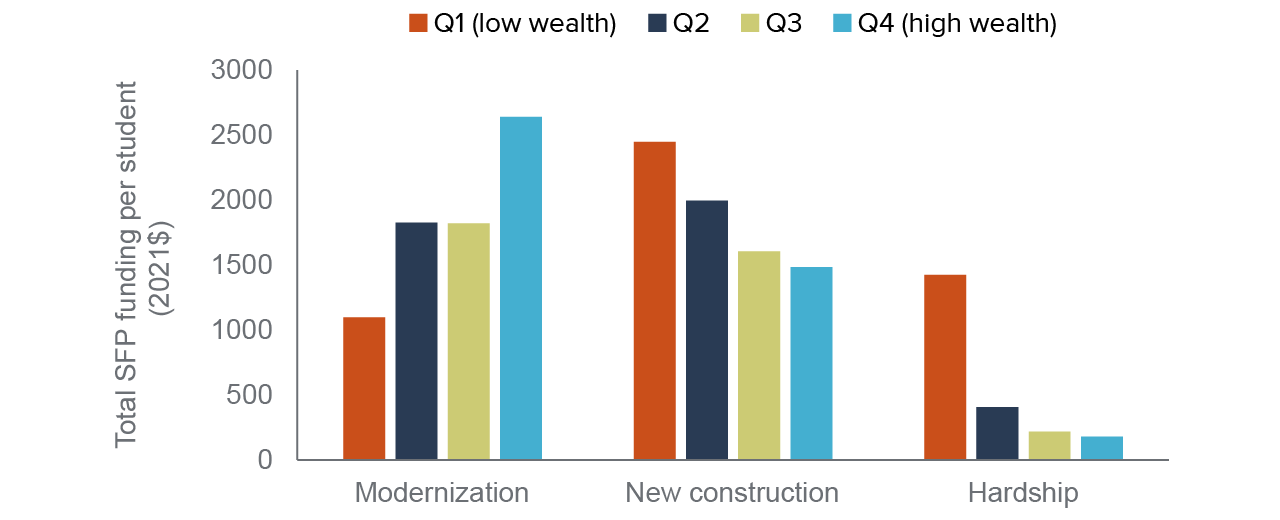
SOURCES: DGS SFP Project Audit Records; California Department of Education; authors’ calculations.
NOTES: Averages are weighted by student enrollment in the district in 2019-20. Quartiles are constructed using 2018-19 assessed value per pupil, which is total assessed value divided by total enrollment. Only districts existing in 2019-20 and with non-missing enrollment data are included. District-level totals are computed in per pupil terms, using district enrollment in the year of the final report. Hardship funding includes facility and financial hardship categories. Funding amounts are inflation-adjusted to 2021 dollars using the CPI-U. See Appendix A for further details.
The data clearly show that SFP funding for new construction tends to go to lower-wealth districts, while modernization funding is highly correlated with district wealth. New construction funding is primarily spent for new facilities in growing districts—they must demonstrate that existing facility capacity cannot house the projected number of students over a 5- to 10-year period. Faster population growth in parts of the state such as the Central Valley and foothill counties meant greater eligibility for new construction dollars in places with less property wealth. Eligibility for modernization funding is primarily based on the age of the facility: to qualify, facilities must be at least 25 years old (non-permanent structures must be at least 20 years old). Unless they are eligible for hardship funding, districts must raise significant amounts of local funding to fund these projects. Moreover, many facilities that meet these criteria have ongoing modernization needs that have not been addressed.
As we noted earlier, both facility and financial hardship funding make up a modest share of overall funding. While the lowest-wealth districts receive significant amounts of hardship funding, the magnitude is much smaller for middle- and higher-wealth districts. Consequently, this funding does little to affect disparities in state and total SFP funding between middle- and high-wealth districts.
Funding differences are also sizable across districts with varying levels of student need, as defined by the Local Control Funding Formula (LCFF). LCFF directs additional operational funding to districts with larger shares of students (also referred to as “unduplicated pupils”) who are defined as high need—low-income students, English Learners, and foster youth. Figure 4 shows that the lowest-need districts in the state have received more in both modernization and new construction funding. Districts in the bottom quartile of student need received roughly $800 (60%) more per student in modernization funding, and $100 (6%) more in new construction funding than those with the most high-need students. However, the highest-need districts received much higher levels of hardship funding. This helps to reduce some but not all of the disparities by district need: total spending on SFP projects and total state funding is higher for the lowest-need than the highest-need districts by 13 percent and 1.5 percent, respectively (Technical Appendix Figure B5).
Both modernization and new construction funding are higher in lowest-need districts
SOURCES: DGS SFP Project Audit Records; California Department of Education; authors’ calculations.
NOTES: Averages are weighted by student enrollment in the district in 2019–20. Quartiles are constructed using data on the district share of high-need students in 2019–20. Only districts existing in 2019–20 and with non-missing enrollment data are included. District-level totals are computed in per pupil terms, using district enrollment in the year of the final report. Hardship funding includes facility and financial hardship categories. Funding amounts are inflation-adjusted to 2021 dollars using the CPI-U. See Technical Appendix A for further details.
Importantly, there is no current alignment between the state’s funding system for annual operating expenses and its program for capital expenditures. Indeed, these differences suggest that distributions under the SFP for the last quarter-century have been regressive with respect to student need, counter to the funding equity goals inherent in LCFF’s rationale and approach. Facility “need” may well differ from the LCFF’s definitions of student “need,” and therefore it may not be desirable for SFP distributions to follow a formula analogous to LCFF. Still, it is unlikely that facility need is negatively correlated with student need under LCFF. National survey evidence shows a positive correlation between student need (defined as the share of low-income students) and facility disrepair, while evidence from more limited FIT self-inspections in California finds no systematic relationship (Alexander and Lewis 2014; Nowicki 2020; Gao and Lafortune 2020).
New Construction Funding Goes Mostly to the Fastest-Growing Districts
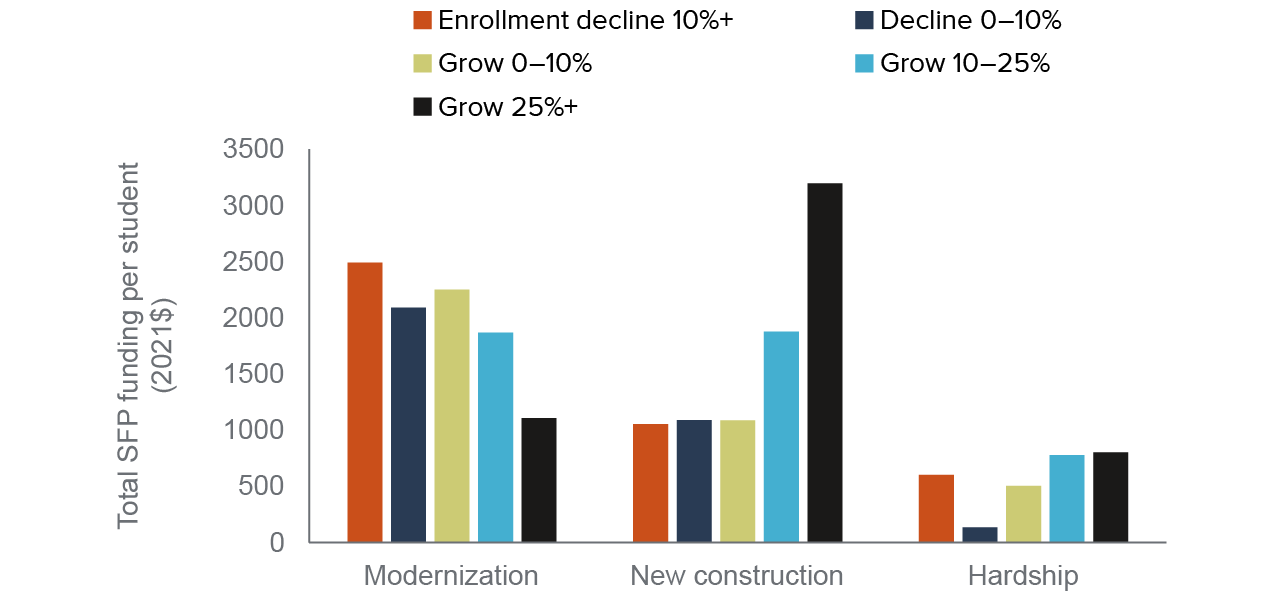
Next, we compare funding across districts with different levels of enrollment growth from 1995–96 to 2019–20. Because eligibility for new construction funding is based on projected enrollment growth, it is not surprising that districts that have experienced a large increase in student enrollment have received more new construction funding. As a result, these districts have fewer buildings that are eligible for modernization and received less modernization money per student (Figure 5). Districts whose enrollment has grown by 25 percent or more received more than $3,000 per pupil in new construction funding, more than $2,000 more than districts where enrollment has declined by 10 percent or more since 1995. The opposite is true for modernization, where eligibility is based on building age. In the future, facility funding criteria will need to factor in the interaction between facility needs and declining enrollment, which is now occurring in a majority of districts and projected to increase over the coming decade (Warren and Lafortune 2020).
Most new construction funding has gone to growing districts
SOURCES: DGS SFP Project Audit Records; California Department of Education; authors’ calculations.
NOTES: Averages are weighted by student enrollment in the district in 2019–20. Quartiles are constructed using data on the share high-need from 2019–20. Only districts existing in 2019–20 and with non-missing enrollment data are included. District-level totals are computed in per pupil terms, using district enrollment in the year of the final report. Hardship funding includes facility and financial hardship categories. Funding amounts are inflation-adjusted to 2021 dollars using the CPI-U. See Technical Appendix A for further details.
In per-Student Terms, Rural Districts Received Less Modernization Funding but More Hardship Funding
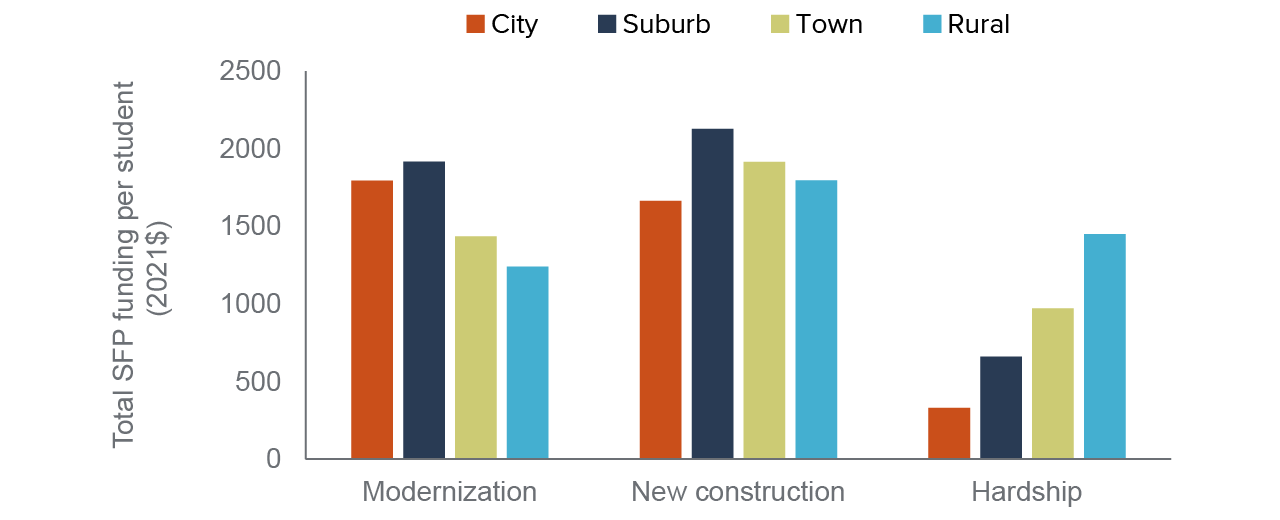
When we look at funding across districts located in cities, towns, suburbs, or rural areas, we see the most notable differences between suburban districts and town or rural districts (Figure 6). Rural districts received 30 percent less modernization funding per student than districts in cities, and 37 percent less than districts in suburbs. New construction funding is also lower for rural and town districts than for suburbs, but the difference is smaller (16% lower for rural vs. suburb; 10% lower for town vs. suburb). Notably, funding is also lower in cities than suburbs for all categories, despite the fact that costs may generally be higher for capital projects in urban areas. Importantly, many suburban areas have experienced enrollment growth in recent decades, and this helps explain the higher levels of new construction funding.
Modernization funding is lowest and hardship funding is highest in rural districts
SOURCES: DGS SFP Project Audit Records; California Department of Education; authors’ calculations.
NOTES: Averages are weighted by student enrollment in the district at the time of the final report upon completion. Locale is defined using a district’s NCES locale code. Only districts existing in 2019–20 and with non-missing enrollment data are included. District-level totals are computed in per pupil terms, using district enrollment in the year of final report. Hardship funding includes facility and financial hardship categories. Funding amounts are inflation-adjusted to 2021 dollars using the CPI-U. See Technical Appendix A for further details.
Hardship funding has been important for rural districts, totaling $1,449 per student, or about 26 percent of state SFP funding for rural districts. By contrast, hardship funding made up 18 percent of state funding for districts in towns, 11 percent for suburban districts, and 6 percent for districts in cities. This difference in hardship funding largely explains why state funding for rural districts is slightly higher than for those in cities and towns (by 5% and 4%, respectively). However, suburban districts still receive the most state funding—6 percent more than rural districts, 10 percent more than town districts, and 11 percent more than city districts. Moreover, higher local funding in suburban districts increases the disparity in total SFP funding (Technical Appendix Figure B7).
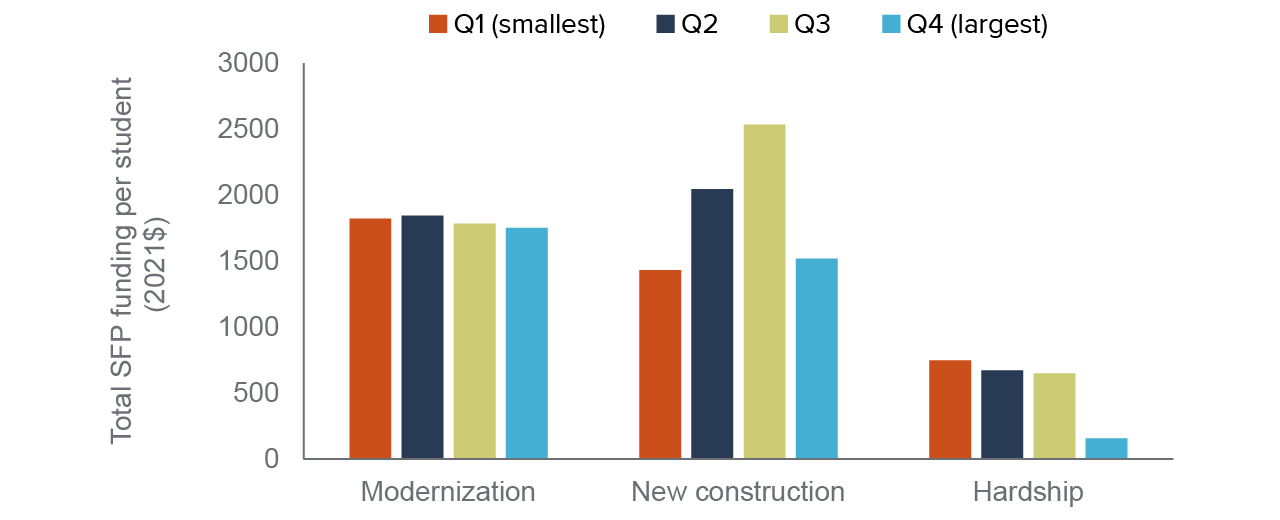
Policymakers and researchers have raised concerns that districts with organizational and financial sophistication have a better chance of securing SFP project funding. Unfortunately, we know of no dataset that measures district sophistication or organizational capacity. However, one might expect larger districts to have more robust central services and financial expertise. To the extent that this is the case, differences in SFP funding by district size might provide suggestive evidence of such an advantage.
Figure 7 shows funding levels for each quartile of district enrollment. Overall, the data paint a mixed picture: modernization funding was similar across districts of different size, while new construction funding was greatest in districts closer to the median enrollment level. This pattern holds true for both the state funding and total SFP project spending (Technical Appendix Figure B8). Hardship funding provided modest support for districts of small to medium size (between $650 and $750 per student), while large districts received much less in the way of hardship funding ($157 per student).
Districts of moderate size have received greater funding, mainly for new construction
SOURCES: DGS SFP Project Audit Records; California Department of Education; authors’ calculations.
NOTES: Averages are weighted by student enrollment in the district at the time of the final report upon completion. Quartiles are constructed using enrollment in 2019–20. Only districts existing in 2019–20 and with non-missing enrollment data are included. District-level totals are computed in per pupil terms, using district enrollment in the year of final report. Hardship funding includes facility and financial hardship categories. Funding amounts are inflation-adjusted to 2021 dollars using the CPI-U. See Technical Appendix A for further details.
Nearly One-Fifth of Districts Have Received No SFP Funding
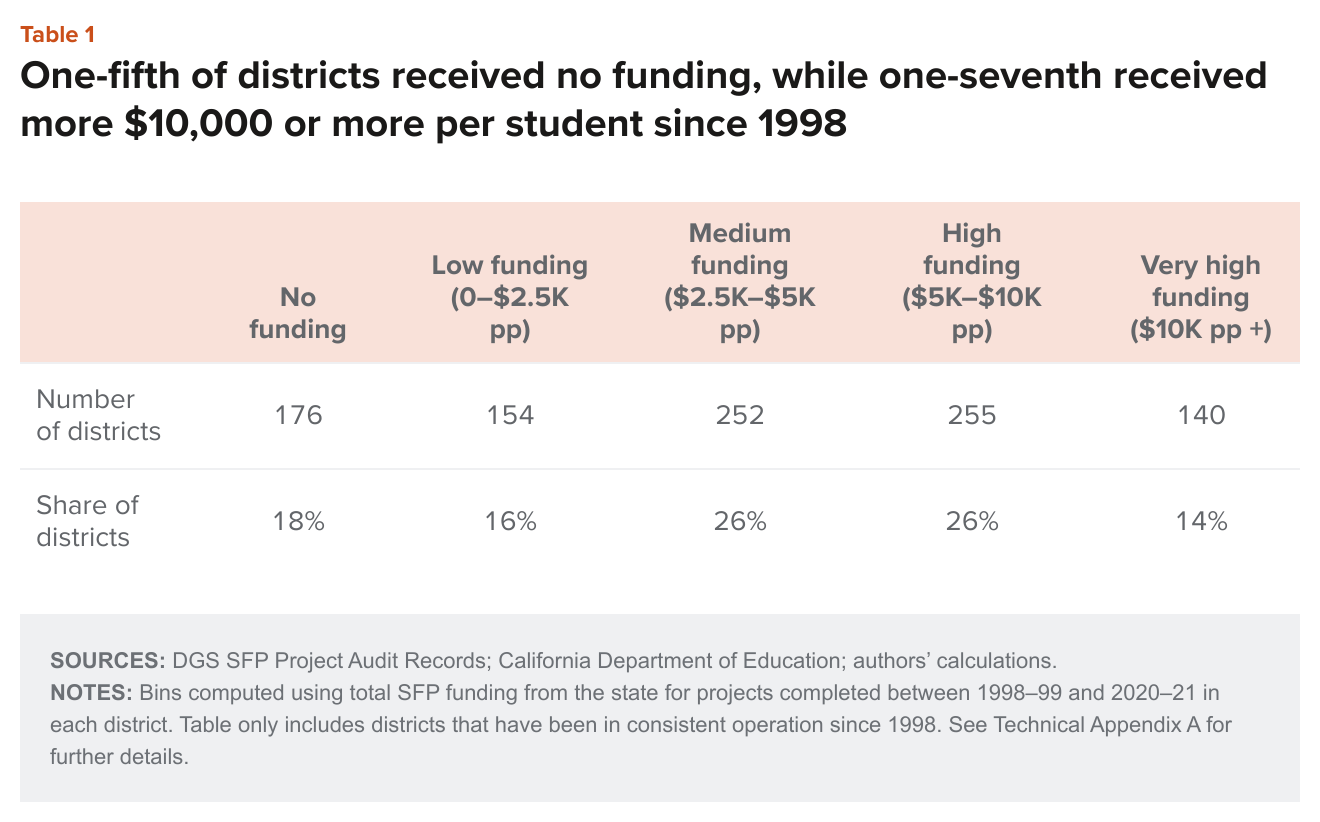
While a comparison of average funding levels across student or district characteristics can reveal important disparities, we also need to compare funding across districts with similar demographics—levels of SFP funding may differ across these districts, and some may have received no funding at all. We divided districts that have been in continuous operation since 1998 into five SFP funding levels: (1) received no SFP funding; (2) received between $1 and $2,500 per student; (3) received $2,500–$5,000 per student; (4) received $5,000–$10,000 per student; (5) received more than $10,000 per student. More detailed demographic and financial characteristics for these districts is included in Technical Appendix Table B1; analogous tables for modernization, new construction, and hardship funding are reported in Technical Appendix Tables B2–B4.
We find that 176 districts (18%) received no SFP funding between 1998–99 and 2020–21 (Table 1). These districts tend to be smaller and to have a slightly higher share of high-need and low-income students than the districts that received SFP funding (Technical Appendix Table B1). Districts that have received no funding have slightly higher shares of Black and white students, and lower shares of Asian and Latino students. They also report high levels of operational and capital spending per student. This is mainly due to their smaller enrollments, but also to their larger shares of high-need students and the mechanics of the LCFF.
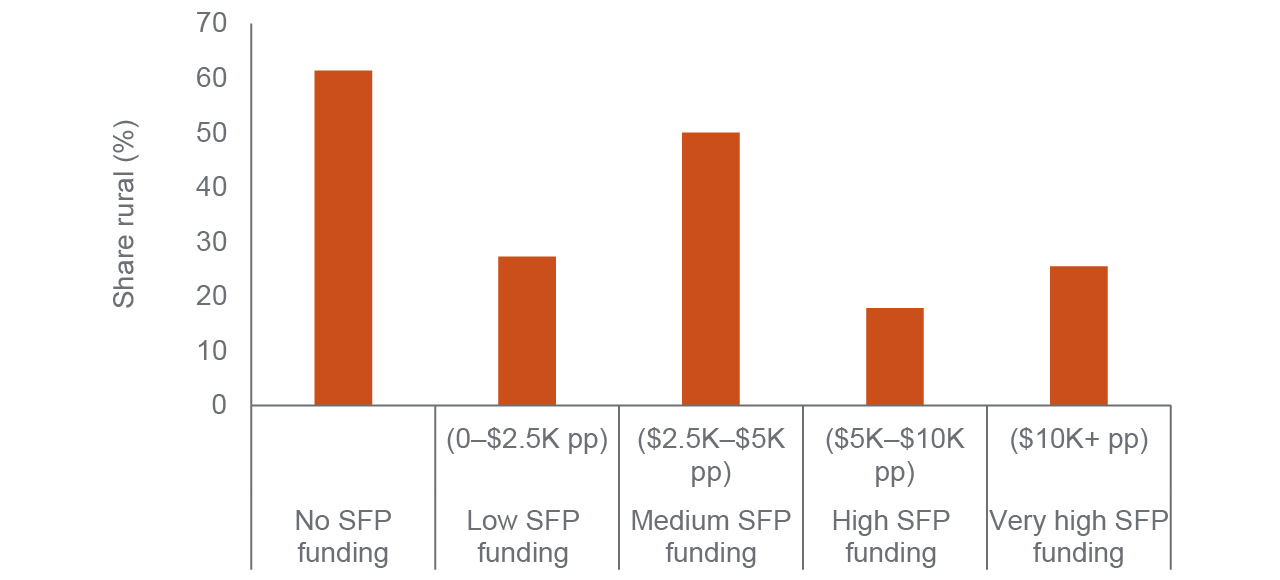
These districts are much more likely to be in rural areas: 61 percent are in rural areas, compared with 38 percent of districts statewide (Figure 8). Rural districts also make up a disproportionately low share of those with high or very high funding levels ($5,000 or more per student). Thus while on average, rural students receive comparable amounts of funding to city and town students (though less than suburban districts), rural districts are disproportionately likely to have received little to no SFP funding since 1998.
Rural districts make up majority of districts that have not received any SFP funding
SOURCES: DGS SFP Project Audit Records; California Department of Education; authors’ calculations.
NOTES: Bins computed using total SFP funding from the state for projects completed between 1998–99 and 2020–21 in each district. Figure only includes districts that have been in consistent operation since 1998. See Technical Appendix A for further details.
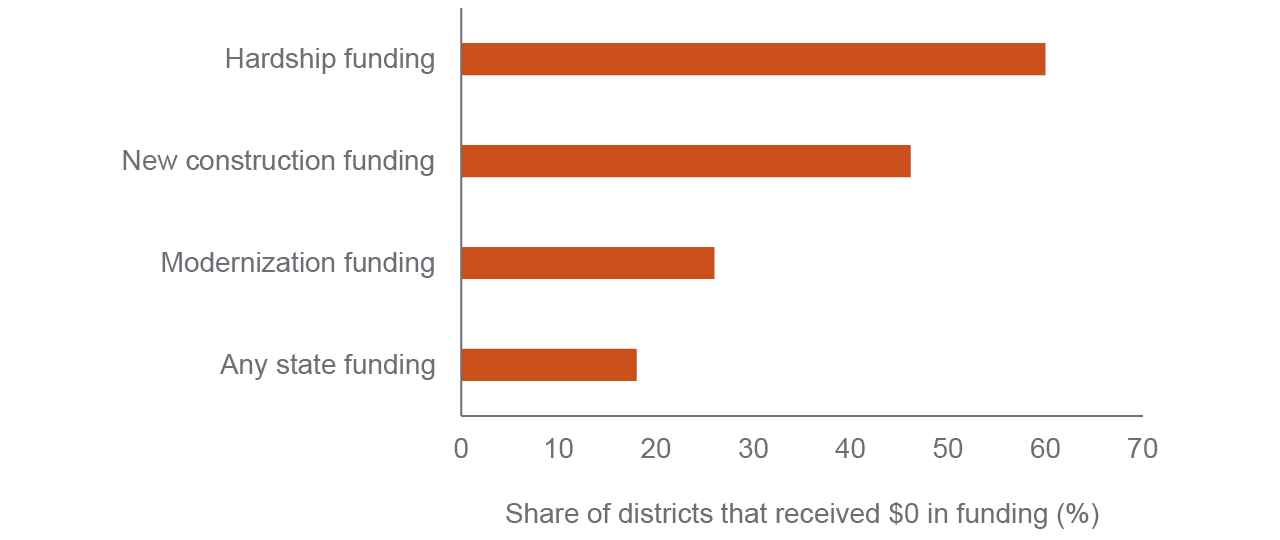
Finally, Figure 9 reports the overall share of districts that did not receive any funding across major SFP funding categories. While 18 percent of all districts received no state funding, 26 percent received no modernization funding and 46 percent received no new construction funding. Stable or declining enrollments in many districts over this time period mean that many were not eligible for new construction funding. Similarly, a majority (60%) of districts did not receive any hardship funding. This suggests that many of the state’s high-need students are in districts that have not received hardship funding; while the districts that did not receive hardship funding have slightly lower shares of high-need and low-income students than those that received hardship funding, they still have student bodies that were majority high-need. We cannot easily determine how many of these districts have faced conditions of financial or facility hardship but did not invest in projects due to an inability to secure local matching funding, but this is a potential policy concern.
Many districts have received no modernization funding, while a majority have not received hardship funding
SOURCES: DGS SFP Project Audit Records; California Department of Education; authors’ calculations.
NOTES: Shares computed using SFP funding for projects completed between 1998–99 and 2020–21. Figure includes only districts that have been in consistent operation since 1998. See Technical Appendix A for further details.
SFP Allocation within Districts Has Been More Equitable
The previous section examined differences across district characteristics and student subgroups, relying on SFP audit data aggregated to the district level. In this section, we rely on audit data to examine funding at the school level. Within-district resource allocation is a much-debated topic in the policy and research world concerning current expenditures (e.g., California State Auditor 2019; Lafortune 2021). Moreover, research shows that the racial composition of local school boards can affect the distribution of SFP funding across school sites attended more predominantly by students of different racial subgroups, affecting differences in student outcomes (Fischer 2021). How do districts allocate their SFP funding—do they target more or less affluent and/or advantaged students? While eligibility for SFP dollars depends on facility needs (e.g., modernization, facility hardship funding) and district characteristics (e.g. new construction, financial hardship funding), the decision to invest in a specific school site in a given year—particularly when funding is limited and all desired projects cannot be completed—may allow a greater degree of discretion for modernization funding than new construction or other SFP funding categories. For this reason, we focus on modernization funding in this section.
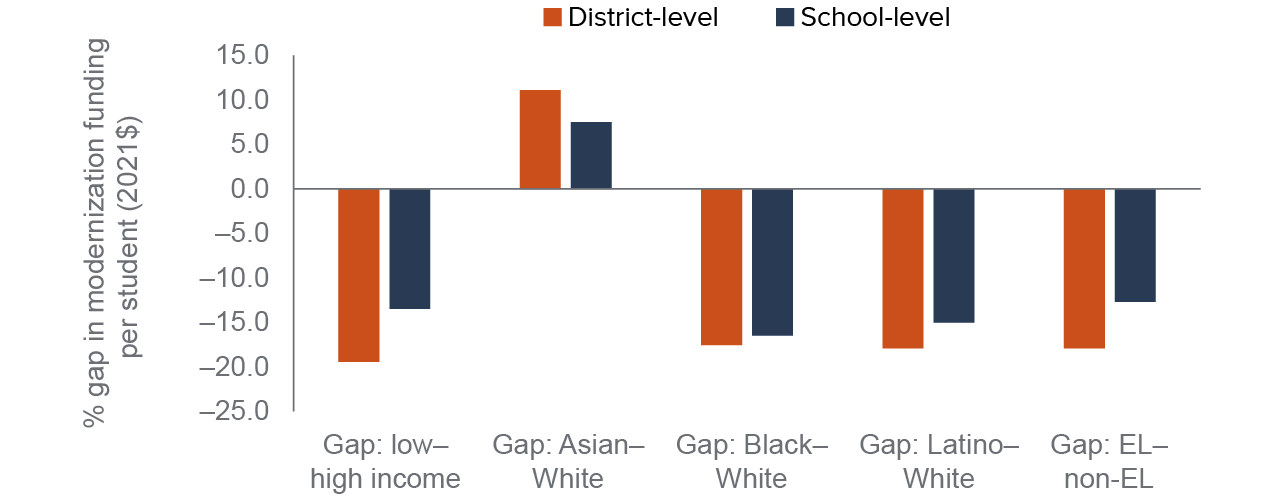
Figure 10 reports the average modernization funding at the district and school levels for different student subgroups, using the school-level SFP audit records. Analogous results for total state funding and total SFP spending are reported in Technical Appendix B9, and show largely similar patterns. For example, we compare the difference in modernization funding for low-income and higher-income students, based on either the district they attend or the specific school they attend. If gaps are smaller at the school than district level, it indicates that districts are generally targeting funds to low-income students across school sites within a district.
As Figure 10 shows, the gaps in the distribution of modernization funding across districts are narrower at the school level. While there is a 19.4 percent gap in modernization funding between the typical low-income and the typical higher-income student across districts, the gap narrows to 13.5 percent when we compare the schools attended by these students on average. In other words, within-district distributions reduce the inequity in modernization funding across student income levels by nearly one-third. Modernization funding gaps by student race (relative to white students) and by EL status are also reduced due to within-district patterns, but to a smaller degree.
Within-district SFP allocations slightly reduce gaps in modernization funding by income, race, and language status
SOURCES: DGS SFP Project Audit Records; California Department of Education; authors’ calculations.
NOTES: Figure includes subset of SFP projects that could be matched to a school site with non-missing demographic data. Figure shows the difference between modernization funding computed at the district and the school levels for students in a particular group. District-level average is computed by assigning districtwide per-pupil SFP spending to a student; school-level averages are computed by using the school-site SFP spending, assigned to a student group. Funding amounts are inflation-adjusted to 2021 dollars using the CPI-U. See Technical Appendix A for further details.
Overall, these data show that while within-district allocations may reduce the disparities generated by which districts receive SFP funding, the difference in the gaps for most categories are small. While there may be scope for increased targeting of resources in some districts, depending on how facility needs interact with student demographics, the differences in funding experienced by student groups are largely determined at the district level.
To more systematically examine how districts target funding, we can estimate the relationship between a school’s demographic composition—its share of low-income students (those eligible for free and reduced-price meals) or its share of students from different racial/ethnic backgrounds—and its level of funding compared to other schools in the same district. (Results are reported in Technical Appendix Tables B5–B9.) As in the previous section, we consider the total amount of SFP funding over the entire program period.
Overall, the results show that (1) districts distributed more SFP funding to school sites with higher shares of low-income and Latino students; (2) districts distributed less funding to school sites with higher shares of Asian students (consistent with the positive gap between Asian and white students shrinking at the school level in Figure 8); (3) there were small and statistically insignificant differences within districts in SFP funding for schools with higher or lower shares of white students.
The results for low-income and Latino students are notable: a 10 percent increase in the share of low-income (Latino) students is associated with having received $389 ($383) more SFP funding per pupil since 1998. Estimates are more mixed for Black students, providing inconsistent but suggestive evidence that SFP investments have been lower for Black students within a district. However, this goes in the opposite direction as the evidence shown in Figure 8, and thus we view this as inconclusive.
Policy Implications and Recommendations
Since 1998, the state has allocated more than $42 billion in statewide general obligation bonds to construct and renovate school facilities. The previous school bond (Proposition 51 of 2016) is expected to be exhausted by 2022–23; the governor’s 2022–23 budget proposes $1.3 billion in 2022-23 and $925 million in 2023-24 in one-time funding to support school facility projects through the SFP. The data make clear that since its inception, the SFP has allocated higher levels of funding to wealthier districts with fewer high-need students. Funding gaps among student groups—whether by income, race/ethnicity, or EL status—are apparent, primarily resulting from the modernization program. Most districts that never received SFP funding were rural, while suburban districts received greater funding amounts across SFP programs and were disproportionately represented among the districts receiving the most funding since 1998.
Analyses of school-level SFP allocations show that districts appear to target schools with lower-income and Latino students—but that these within-district flows do little to address overall funding disparities, which are largely driven by districtwide characteristics. Districts have a limited ability to be more or less progressive in distributing their facility funding across school sites. This suggests that efforts to augment which districts are able to receive funding may be more impactful than efforts to influence which specific schools within districts are targeted by facility improvements.
Existing evidence shows that capital spending is higher in higher-income and wealthier school districts—both within California and across the nation—largely due to the reliance on local bond issuances linked to property tax increases as a financing mechanism (Brunner and Vincent 2018; Biasi et al. 2021). Ideally, state funding would serve as a counterweight to disparities in local wealth and fiscal capacity, helping districts that have smaller local tax bases or lower ability to self-fund for other reasons. The past two and a half decades indicate that this has not been the case for the SFP. Indeed, the SFP modernization program appears to have exacerbated rather than mitigated these inequities. The reliance on matching grants, the first-come first served nature of allocations, and the relatively small amounts allocated under hardship programs all appear to contribute to these gaps.
Total state funding is more equitable when comparing districts of varying wealth levels, though gaps are still apparent among student income levels, races/ethnicities, and EL statuses. However, the fact that total funding appears more equitable along some dimensions is largely the result of new construction funding, which will be less relevant for statewide facility needs in the future, as the state is projected to experience declining enrollment for at least the next decade. For this reason, policymakers interested in improving equity in future SFP program funding decisions should pay careful attention to the modernization program.
We offer four broad recommendations that policymakers should consider when devising any future SFP program funding:
- Improve equity in state capital funding allocations, particularly modernization. The failed Proposition 13 (2020) proposed tweaks to the mechanics of the program, such as a sliding scale for matching amounts based on local wealth and/or need, priority based on a criteria of facility need, and greater funding allocated for hardship cases, all of which could help improve the overall equity of the program. Such tweaks should be considered in future SFP decisions; making it easier to qualify for hardship funding may also help allow more districts with financial or facility difficulties to qualify for state funds.
- Improve data collection and reporting on facility conditions. Despite spending billions to maintain and construct school facilities, the state collects little systematic information on the condition of its school capital stock. FIT assessments provide a baseline, but these are insufficient to guide resource allocation decisions. The state should establish a statewide inventory of school facilities, with periodic conditions assessments. Comprehensive data collection on school facility age would be a good start, and could help the state predict future eligibility and need for SFP modernization funds (California State Auditor 2022).
- Allocate state funding based on facility needs. Targeting districts with the greatest facility needs—in terms of new capital outlay as well as maintenance—would be the most effective and efficient use of funding given scarce state resources. Mounting pressures from declining enrollment, the COVID-19 pandemic, and climate change will also likely result in heterogeneous needs for school facility improvements across districts. The failed Proposition 13 from 2020 would have required submission of facility master plans by districts seeking SFP funding. District facility master plans—if required in the future—should clearly prioritize remedying the worst conditions and prioritize equity in facilities within the district. Similar requirements in future bond proposals would go a long way to improve the state’s ability to quantify facility needs and more effectively target funding.
- Provide greater technical assistance to districts. The state’s first-come first-served allocation puts small and rural districts at disadvantage (Vincent and Jain 2015). As a result, many districts never received funding through the SFP program, two-thirds of these being rural districts. Greater technical assistance in and before the application process could help districts that may lack the fiscal and organizational resources of larger districts. Furthermore, comprehensive and continuous assessment of facility conditions can be challenging and costly, and would be more difficult for smaller districts. Greater capacity for county offices of education and/or the CDE to assist districts would likely be necessary were requirements for more rigorous facility assessments to become mandatory. There is some precedent to this: under Williams, county offices had assisted schools in the bottom three deciles of Academic Performance Index (API).
California’s school buildings require continued investments to meet current and projected need arising from aging school facilities, changes in educational programs, and compliance with federal and state regulations. Historically, the state has relied on general bonds to fund SFP, and the unpredictable nature of bond issuances has led to inconsistent funding over time. Moreover, SFP funding has disproportionately benefited more affluent districts and students, raising equity concerns. As policymakers explore ways to fund and improve school facilities, consistent and equitable funding streams will be essential to help ensure that all students have access to a safe and effective learning environment.