

Key Takeaways
As students return to full in-person learning in 2021–22, California public schools face considerable challenges brought on by the COVID-19 pandemic. Record-high funding distributed through the Local Control Funding Formula (LCFF) will provide some of the resources that will be key to an equitable recovery. In order to examine how school districts distribute LCFF funding and how the formula affects student achievement, we have assembled data on district finances, school finances, and student outcomes across the state’s public K–12 system.
- Under LCFF, resources were distributed more equitably across districts. Revenues and spending increased fastest in high-need districts. →
- After LCFF implementation, outcomes were distributed more equitably across districts. Test scores and A–G completion increased most in the highest-need districts after the state fully implemented the funding formula. →
- Test score gaps narrowed more by district than student need. District-level gaps in test scores, graduation, and A–G completion narrowed faster than gaps between student subgroups. →
- A slight majority of funding for high-need students reaches the school that generates it. Statewide, roughly 55 cents of every dollar of additional funding for high-need students is spent at the school that generates the funding; districts vary considerably in how they allocate additional resources to schools with the most high-need students. →
- Policymakers should improve reporting to enhance tracking and transparency of funding. We also recommend consideration of a funding mechanism based on school site need and increasing supplemental grants and/or lowering the threshold for concentration grants. →
Introduction
As more California public schools return to full in-person operations, parents, educators, and state policymakers face unprecedented challenges to accelerate learning and address divides after a year of remote learning. Inequitable access to devices, internet, and in-person learning—along with the disproportionate effects of the pandemic on low-income households and households of color—have underscored concerns that gaps have grown (Gao, Hill, and Lafortune 2020). Test scores from some California districts (Pier et al. 2021) and from other states (Kogan and Lavertu 2021; Lewis et al. 2021) have heightened these concerns.
A better-than-expected state budget, however, has provided record-high levels of school funding for California students. Together with robust federal stimulus, school leaders will have considerable new financial resources to address many of these challenges. In addition to significant one-time education expenditures from the state, an important share of increased state funding will flow through the state’s Local Control Funding Formula (LCFF), enacted in 2013–14 to simplify and improve equity in school funding.
Notably, the enacted 2021–22 budget includes $1.1 billion for an ongoing increase to LCFF, tweaking the funding formula to provide greater funding for the state’s highest-need school districts. However, questions remain about how to best allocate new funding, and whether relative funding increases under LCFF are an effective mechanism to foster improvements in student outcomes.
As the key mechanism directing tens of billions of dollars in state funding, LCFF affects the equity, efficiency, and efficacy of the California public school system; it is therefore critical for practitioners, policymakers, and researchers to understand the effects of LCFF. To date, we have limited information on the effects of LCFF on student outcomes.
Johnson and Tanner (2018) found a link between increased funding and 11th-grade test scores and graduation rates through 2018, right as the formula had become fully funded. Yet despite these early indications of success, achievement gaps by student income, race, and language status have remained large and stubbornly persistent. Moreover, critiques of LCFF funding mechanisms have grown, often centered on concerns that funding intended for districts’ highest-need students is not reaching them (Howle 2019).
To further our understanding of LCFF and its impact, in this report we synthesize a number of public data sources—including newly released data from the federal government on within-district spending patterns. We focus only on the changes in funding, spending, and outcomes due to the funding formula; LCFF may well have additional effects because of increased local control and flexibility, greater local stakeholder involvement, and a broader set of state priorities. While important, these aspects of LCFF are outside of the scope of this report. We ask three primary research questions:
- How has LCFF altered spending and changed resource levels in schools and districts of varying need?
- Is LCFF funding equitably distributed within districts, and is funding reaching the schools and students with the greatest need?
- Has increased funding led to improved student outcomes in the districts targeted by the formula?
We begin with a brief overview of LCFF in the context of California school finance history. We then document how LCFF has affected district finances and where districts are choosing to spend their additional funding. Next, we turn to the question of within-district resource allocation, and provide new statewide evidence on whether resources are reaching the students and schools within districts that have the greatest student and academic needs. Finally, we examine trends and changes in measurable student outcomes to determine the extent to which increased spending translates into improvements. We conclude with a set of policy considerations and recommendations to improve LCFF and California’s system of school finance to more effectively and equitably address disparities in student success.
District Resources Before and After LCFF
Like many other states, California’s history of school funding has been shaped by tensions between local and state control, and accordingly, local and state funding sources. Today, the majority of school funding (59%) comes from state revenues, with property taxes and other local revenue sources comprising 32 percent of funding. The federal government contributes less than 10 percent, mostly to specific programs.
However, this was not always the case: for much of California’s history, schools primarily relied on local funding sources—property taxes in particular. This reliance on local funding generated large differences between more- and less-affluent areas. California’s Supreme Court found these differences to be unconstitutional in 1971 in Serrano v. Priest, ordering a legislative remedy.
The resulting “revenue limit” system mostly equalized per-student funding across districts by capping the amount of revenues a district could receive and using additional state funding to make up the difference for those districts with insufficient local revenues. The state’s role in school funding subsequently grew: Proposition 13 (1978) imposed limits on property taxes, and state-funded “categorical” programs earmarked funds for specific purposes. At their peak, categorical funding streams accounted for about 20 percent of total state funding for public schools and they restricted how districts could spend funds.
How LCFF Changed School Funding
The adoption of the Local Control Funding Formula in 2013–14 completely overhauled this funding system. LCFF eliminated most categorical funding programs, replacing them with a simpler and more flexible funding system. Districts receive a base grant per unit of average daily attendance (ADA), which varies slightly depending on the grade level. Districts then receive additional funding on top of the base grant based on the proportion of “high-need” students they serve—often referred to as the unduplicated pupil percentage, or UPP.
Funding levels relate to a district’s share of the state’s high-need students (Figure 1). Districts with no high-need students receive no additional funding per student on top of the base grant. For every additional high-need student, the district receives 20 percent on top of the base grant in supplemental grant funding. In concentration districts, each additional high-need student generates additional funding beyond the 55 percent threshold at 50 percent above the base grant—referred to as the concentration grant.
Thus, a district that is 40 percent high-need gets 8 percent additional supplemental grant funding on top of their base grant, per student. A district that is 60 percent high-need (roughly the median statewide) gets 14.5 percent on top of the base grant; a district that is 80 percent high-need receives 28.5 percent more funding. In the 2021–22 enacted budget, the state increased the concentration grant from 50 percent to 65 percent, providing even greater funding increases for very high-need districts. Later, we will examine the implications of this change on funding levels across high-need schools and districts.
LCFF directs additional funding based on a district’s share of high-need students

SOURCE: California Department of Education.
NOTES: UPP refers to the “unduplicated pupil percentage” of low-income, English Learner, and foster youth in a district. Figure shows the percent increase in base grant funding for a district with a given share of high-need students.
Where Are the State’s High-Need Students?
The funding formula targets funding based on the concentration of high-need students in a district. This does not perfectly target high-need students: not all high-need students are in high-need districts, and many non-high-need students are in high- and the highest-need districts (Table 1).
Overall, concentration districts enroll 66 percent of the state’s students—and nearly 81 percent of high-need students. However, just under half (43%) of non-high-need students are also in these districts. In lower-need districts, just over 21 percent of schools are concentration schools. Eleven percent of the state’s concentration schools are in these districts. This distribution has important implications for how funding is targeted within and across districts under the funding formula, a point which we will examine in detail the next section of the report.
High-need students and schools are distributed across California districts of varying need
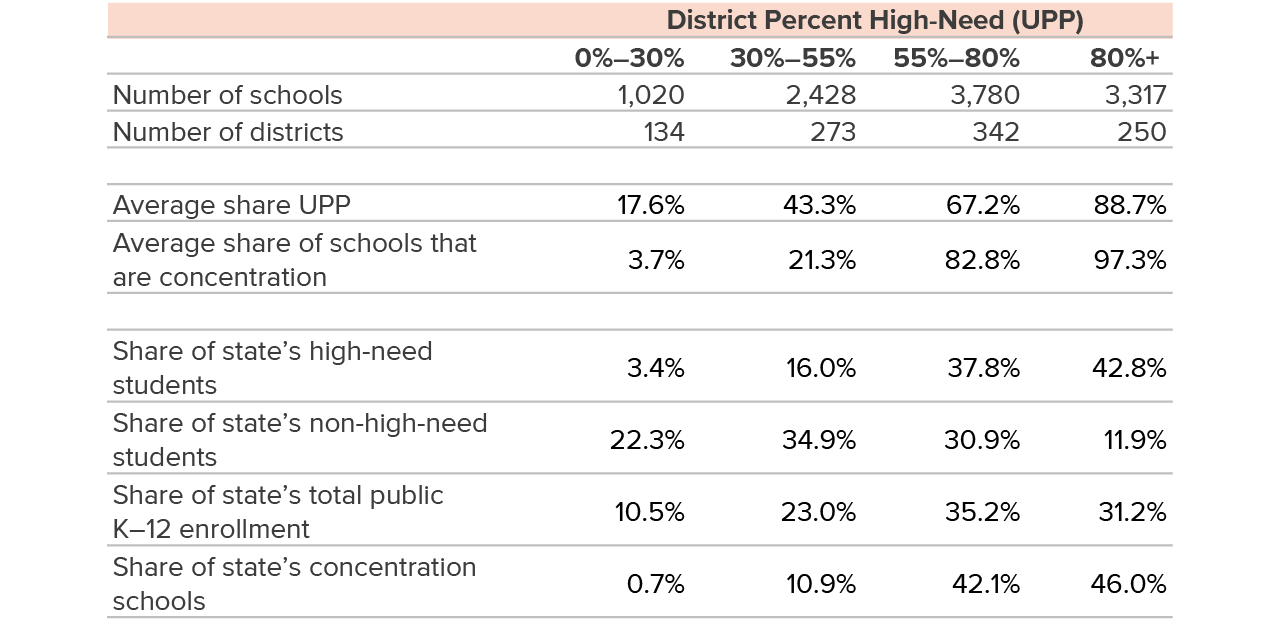
SOURCES: California Department of Education, enrollment files; Author’s calculations.
NOTES: UPP refers to the district-level “unduplicated pupil percentage” of low-income, English Learner, and foster youth in a district. Only districts and schools with non-missing enrollment and UPP data are included. Table uses enrollment data from the 2019–20 school year.
Spending Increased More in Highest-Need Districts
The shift to a funding system weighted by student need altered how the state distributed funding across districts of varying need. After years of painful spending cuts during and after the Great Recession, state education funding began to rebound around the time LCFF passed (Lafortune, Mehlotra, Paluch 2020). A robust state economy and significant changes in state tax policy supported annual funding increases from the time LCFF passed until the COVID-19 pandemic, and the funding formula directed more of this money toward districts with greater shares of high-need students through supplemental and concentration grant funding.
Funding formula revenues from state and local sources have evolved over time (Figure 2) and across different formulas. If we compare funding over time based on share of high-need students in 2013–14, districts had very similar revenues prior to LCFF: in 2003, districts with low shares of high-need students received on average $6,943 per student through the formula, compared to $7,001 in the highest-need districts.
Only after California passed and implemented LCFF did higher-need districts see funding formula revenue grow relative to lower-need districts. By 2019–20, the highest-need districts received nearly $2,700 more per student annually under the formula than the districts with lowest shares of high-need students.
Funding formula revenues increased more for higher-need districts under LCFF
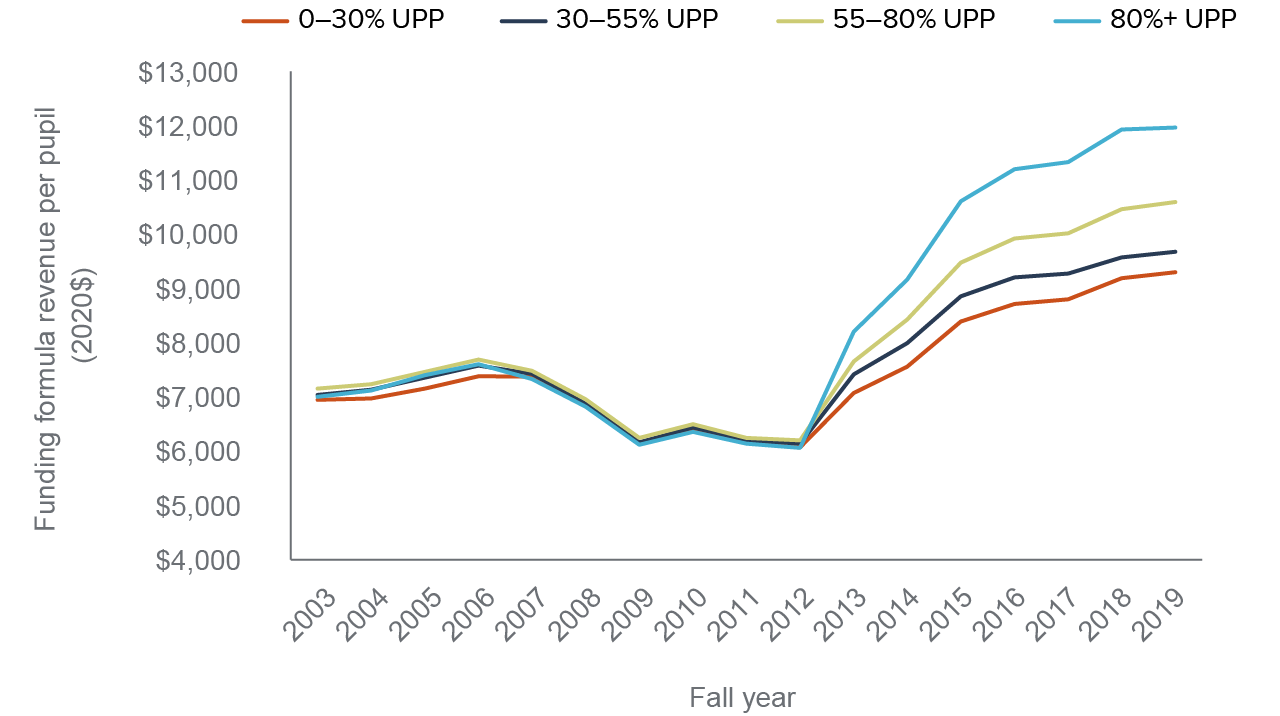
SOURCE: California Department of Education, SACS district finance data and enrollment files; Author’s calculations.
NOTES: Basic aid districts are excluded. Figure plots the yearly funding formula revenues per pupil, in inflation-adjusted 2020 dollars. UPP refers to the “unduplicated pupil percentage” of low-income, English Learner, and foster youth in a district; UPP is fixed to a district’s level in 2013–14 in this figure. Averages are weighted by average daily attendance (ADA). Districts with ADA less than 250 are excluded. Districts with greater than 500 percent or less than 20 percent of California mean spending per pupil or funding formula revenues per pupil are excluded. See Technical Appendix A for further detail on data sources and sample restrictions.
However, this excludes other forms of revenue, including federal, restricted state funding, and other local sources outside of the formula. When we include all revenue sources, revenues for high-need districts have been above that of lower-need districts since before LCFF, although they still increased quickly for both types of districts since LCFF was implemented (see Technical Appendix Figure D1).
For this reason, differences in per-pupil spending since the onset of LCFF show a different pattern than revenues (Figure 3). Notably, total per-pupil spending was higher in 2012–13 for the highest-need ($14,500) and the lowest-need ($13,500) districts than for districts in the middle of the distribution ($12,100 and $12,900, for 30%–55% and 55%–80% high-need districts, respectively).
The same pattern held true in 2019–20, the most recent year for which we have statewide district financial reports: the highest-need districts spent $19,300 per student, compared to $17,600 and $16,100 among lower-need districts, while the lowest-need districts spent nearly $18,500.
When analyzing spending, it is helpful to separate spending into two important but distinct components: K–12 student spending, which comprises most operational expenses that are relevant for students’ day-to-day educational experiences, including staffing, materials, staff benefits, and other services; and non-K–12-student spending, which comprises other district spending categories including capital outlay (e.g., school constructions or renovations), adult and pre–K education, and debt service (Bruno 2018).
Figure 3 also reports spending levels in 2012–13 and 2019–20 for these two major subcomponents, by district share of high-need students in 2013–14 (the first year UPP data were collected). Spending increased across districts of all levels of student need following LCFF, with larger increases in student spending among higher-need districts. Conversely, lower-need districts saw larger increases in non-student spending, primarily driven by greater expenditures on capital outlay.
K–12 student spending increased most at highest-need districts by 2019
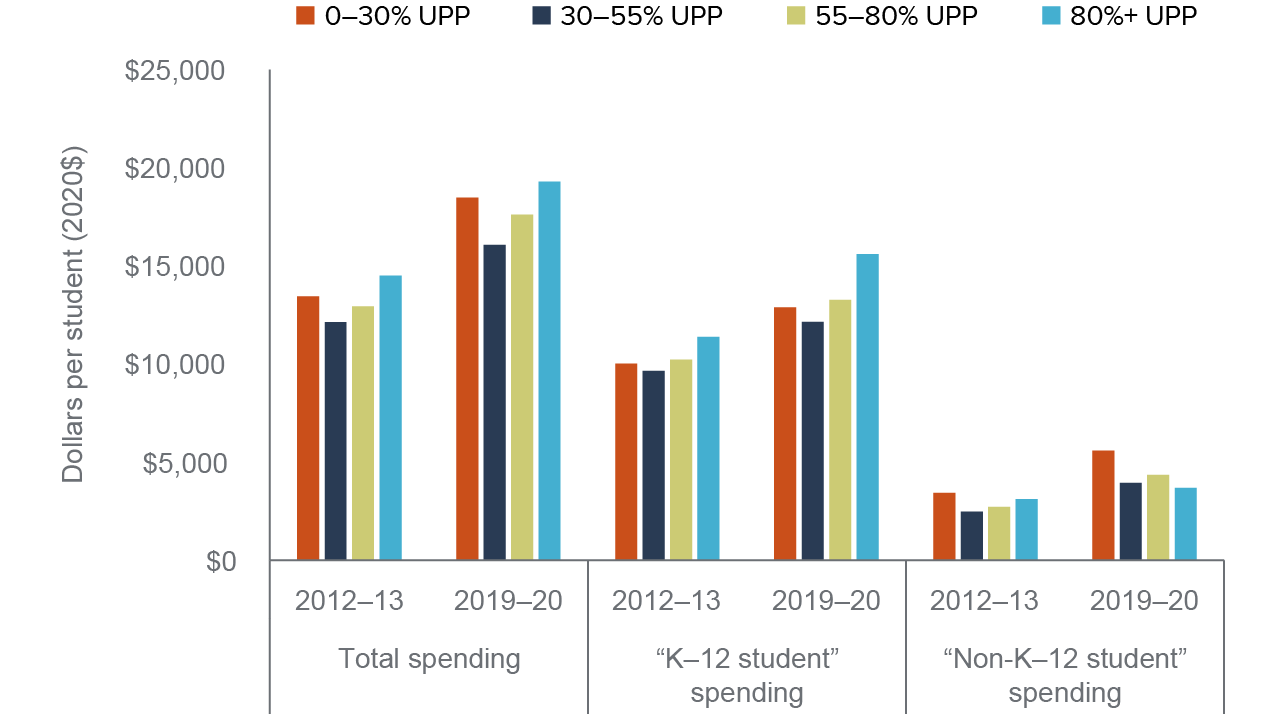
SOURCE: California Department of Education, SACS district finance data and enrollment files; Author’s calculations.
NOTES: Figure plots the “student” and “non-student” spending per pupil (see text for definition), in inflation-adjusted 2020 dollars. UPP refers to the “unduplicated pupil percentage” of low-income, English Learner, foster youth, and homeless students in a district. Averages are weighted by average daily attendance (ADA). Districts with ADA less than 250 are excluded. Districts with greater than 500 percent or less than 20 percent of California mean spending per pupil or funding formula revenues per pupil are excluded. See Technical Appendix A for further detail on data sources and sample restrictions.
Moderate-need Districts Had Smaller Spending Increases
High-need and lower-need districts that enroll fewer but still substantial numbers of high-need students had similar or even smaller spending increases than the average among the lowest-need districts in the state. Some of this results from the greater capacity for more affluent districts to raise property tax revenues in excess of the LCFF funding formula target or through other sources, such as parcel taxes.
Some of this difference is also due to the funding formula itself, which targets even greater funding increases to districts with the highest concentrations of high-need students. This effect is most easily seen by the “kink” in the funding formula at 55 percent high-need (Figure 1); in a strictly financial sense, high-need students in these districts generate more in funding than identical students in districts with lower levels of need. Indeed, the majority of the state’s high-need students (roughly 54%) are in districts with moderate to high levels of need, between 30 and 80 percent (Table 1). This distinction will be important to consider when we examine effects on statewide achievement gaps—if LCFF has led to only small relative increases in resource levels for the majority of the state’s high-need students, one may not expect as large of improvements in student-level achievement gaps from these financial changes.
Of course, the highest-need districts are often the ones that could stand to benefit the most from additional resources. Even when examining low-income students specifically, a strong relationship still exists between a district’s share of low-income students and academic performance (Warren and Lafortune 2019). However, low-income (and high-need) status can vary from year to year for many students, and only partially captures what is in reality a continuum of student economic circumstance (Michelmore and Dynarski 2017; Fazlul, Koedel, and Parsons 2021).
Viewed in this sense, the concentration grant implicitly targets this continuum of need at the district level even though low-income (or high-need status) is a fundamentally binary designation. That is, under the assumption that high-need students in districts with higher concentrations of need would see a greater benefit from additional funding, the kink in the formula improves efficacy and equity relative to a more steep, but equal slope throughout the distribution of district need.
Indeed, in the seminal white paper proposing the mechanism of school finance reform that would lay the foundation for LCFF, Bersin, Kirst, and Liu (2008) motivate concentration funding by citing evidence that concentrated poverty has its own negative impact on achievement. However, similar arguments may hold for the concentration of poverty and need at the school, rather than the district level, which LCFF does not directly target. In the next section, we will discuss the implications of how spending is targeted across schools within the same district, which is key to determining the extent to which LCFF improves resource equity at the student level.
How Districts Spent LCFF Funding
What additional resources did this extra funding provide? Spending on teacher salaries increased significantly in districts of all levels of need, but by only slightly more in the highest-need districts (Figure 4). Higher-need districts increased spending on salaries for pupil services and other support staff besides teachers and administrators (e.g., nurses, counselors, teachers’ aides) more than lower-need districts.
Increases in administrative salaries were relatively small across districts (less than $200 per student on average, statewide); the fact that they were also very similar across districts of varied need implies that little of the additional supplemental and concentration grant funding due to the formula went towards additional administrative expenses.
The largest spending increases under LCFF went to staff benefits and salaries
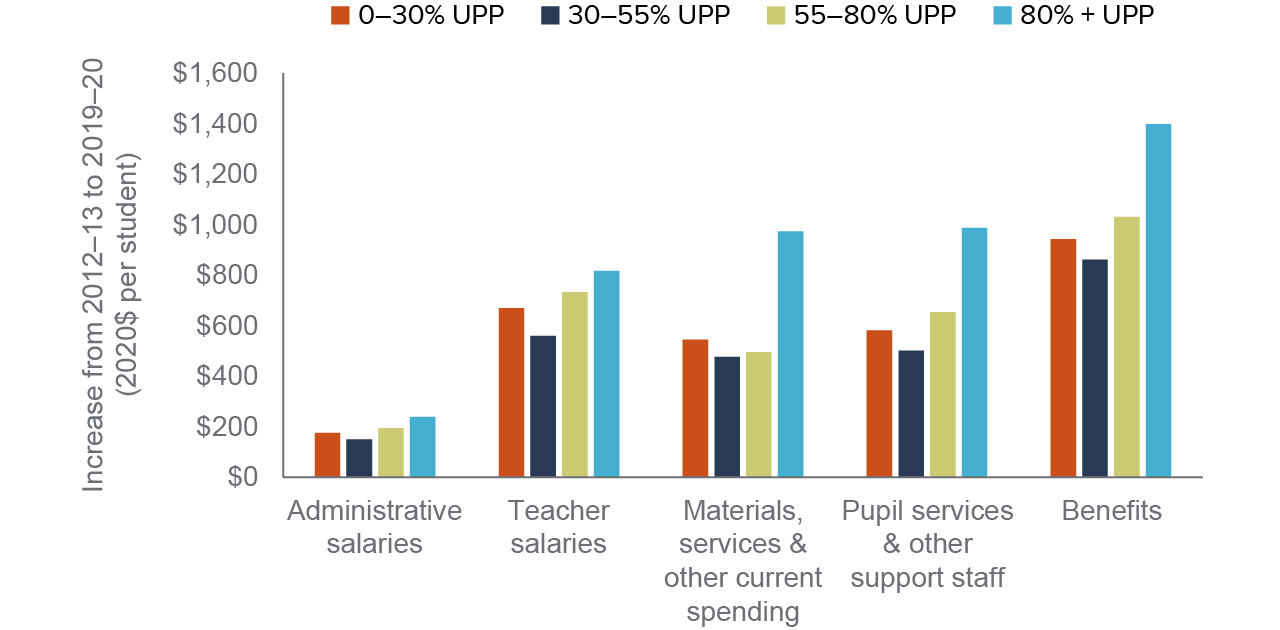
SOURCE: California Department of Education, SACS district finance data and enrollment files; Author’s calculations.
NOTES: Figure plots the average increase in spending from 2012–13 to 2019–20 for subcategories of student spending, in inflation-adjusted 2020 dollars. UPP refers to the “unduplicated pupil percentage” of low-income, English Learner, foster youth, and homeless students in a district. Averages are weighted by average daily attendance (ADA). Districts with ADA less than 250 are excluded. Districts with greater than 500 percent or less than 20 percent of California mean spending per pupil or funding formula revenues per pupil are excluded. See Technical Appendix A for further detail on data sources and sample restrictions.
The highest-need districts also spent more on materials, services, and other current spending categories (e.g., textbooks, instructional materials, consultants). Districts with 80 percent or more high-need students increased their spending on these resources by nearly $1,000 per student since LCFF passed, while districts with fewer high-need students raised spending by only half the magnitude.
Notably, the largest spending increases were in the category of staff benefits, the result of multiple factors. First, legislative changes have more than doubled districts’ required contribution to employee pension plans. On average, higher-need districts spend more on salaries, which partially explains the larger increase in benefit spending among the highest-need districts.
Second, per-staff benefit costs have continued to increase since LCFF passed (Bruno 2019). As higher-need districts and schools generally staff more people—but spend similarly because they rely on less-experienced and credentialed educators (Lafortune 2019)—any increase in per-staff costs will disproportionately affect these districts. Despite revenue increases in recent years, staffing costs continue to put pressure on school district budgets (Krausen and Willis 2018; LAO 2020). Thus, while LCFF has led to greater spending—particularly in the districts with the greatest shares of high-need students—mounting cost pressures may affect school districts’ ability to translate greater funding into improved resources and services for students.
LCFF Efficacy and Targeted Dollars
While the funding formula targets districtwide need, it does not explicitly allocate these dollars to the students or schools that generate this additional district funding. If districts spend their supplemental and concentration grant funding only on high-need students, then any distinction between district- and school-level (or even student-level) funding is unimportant. However, if districts spend equally on all of their students, then it limits the ability of the LCFF formula to distribute spending progressively. There are numerous examples that suggest that districts may not be fully targeting LCFF dollars:
- An investigation by the state auditor into LCFF spending in two districts had difficulty tracking the supplemental and concentration grant spending, and critiqued the practice of rolling unspent supplemental and concentration funding into the general fund if it was not spent down in a given year (Howle, 2019).
- Complaints filed by advocates charged Los Angeles Unified School District with improper accounting and reporting of supplemental and concentration grant funding.
- A memo to school districts from the former state superintendent of schools in 2016 clarified that districts could spend supplemental and concentration grant dollars on general salary increases for staff districtwide, reversing an earlier position expressed by the Department of Education (Fensterwald 2015).
- The California Department of Education ruled in June 2021 that the San Bernardino County Office of Education erred in approving district spending plans that did not adequately target supplemental and concentration grant funding to improve services for high-need students, following complaints filed on behalf of local advocates.
LCFF Impact Is Attenuated without Targeting
How districts target funding is crucial in the many California districts that have schools of varying levels of student need, poverty, and racial composition. Unfortunately, no comprehensive statewide database details how funding is allocated within a district over time.
Here, we examine the trends in funding between districts, schools, and students of varying income levels under the baseline assumption that districts spend equally on their students. We use income rather than the LCFF definition of student need, as this was defined pre-LCFF. Of course, perfectly equal spending within-district does not hold in practice, but it is nonetheless a useful baseline comparison.
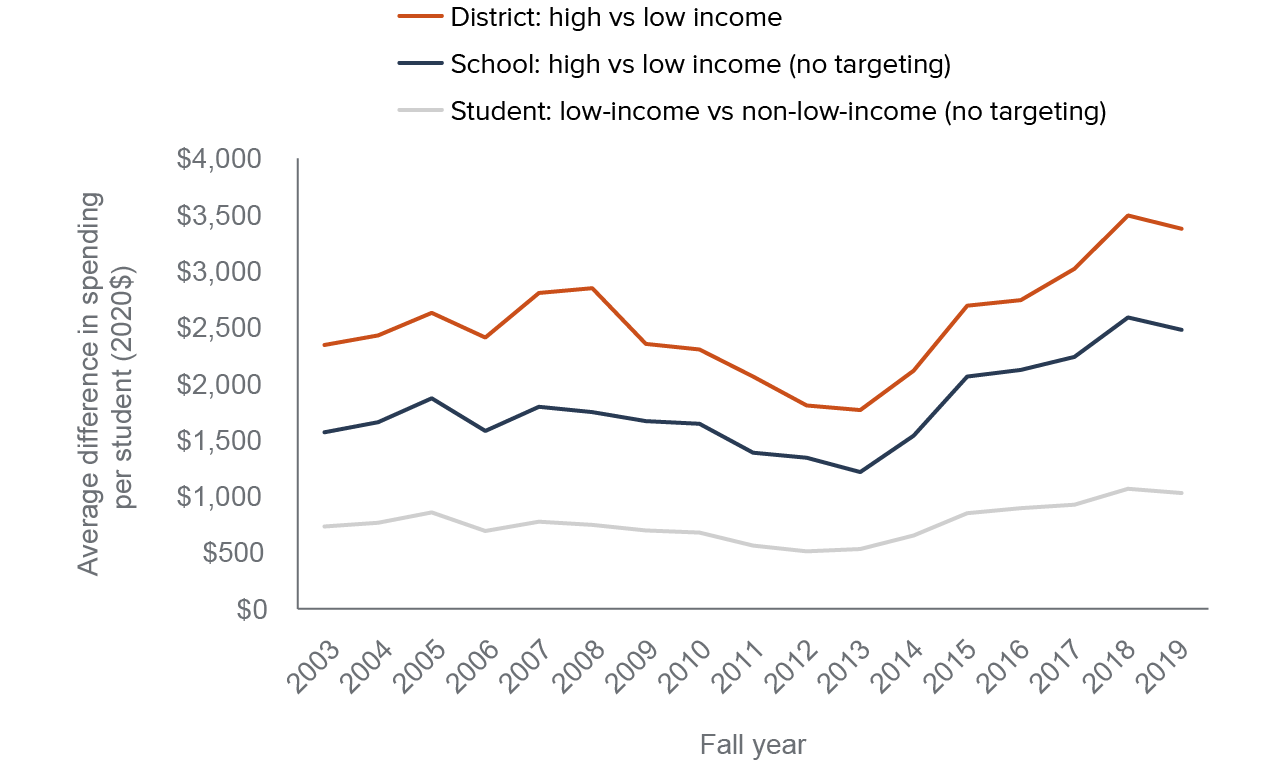
Figure 5 reports the differences in spending between high- and low-poverty districts, schools, and students over time under the hypothetical assumption that districts spend equally on each of their students. Three “gaps” in spending appear over time: a difference in per pupil spending between high- versus low-income districts, between high- versus low-income schools, and between low-income and non-low-income students. Here, because spending is measured at the district level, each school and student is assigned their district’s average per pupil spending, as if districts spend equally on their students.
Importantly, per pupil spending is much higher in high-poverty than in low-poverty districts, with a difference of nearly $3,500 per student in recent years. However, when comparing high- and low-income schools, this difference is smaller: roughly $2,500 per student. Finally, low-income students are in districts that spend roughly $1,000 more per student than in the typical non-low-income student’s district. The relative increase in spending is notable since LCFF was passed in 2013, reflecting the mechanics of the formula.
However, if districts do not target spending to their highest-need students, the impact on funding gaps by school and student is much smaller. Under the assumption that the funding formula intends to direct resources to high-need students to improve their educational outcomes, how well LCFF can reduce educational disparities depends on which schools and students districts choose to spend their additional funding at.
In the absence of targeted funding, spending differences by student income may shrink
SOURCE: California Department of Education, SACS district finance data and Student Poverty FRPM data; Author’s calculations.
NOTES: Figure plots the difference in mean K–12 student spending between high- and low-income districts, schools, and students over time, based on eligibility for free and/or reduced-price lunch. District-level gap is the difference in spending between the highest and lowest quartile of district share low-income. School-level gap is the difference in spending between the highest and lowest quartile of schools in terms of school share low-income. Student-level gap is the difference in spending between low-income and non-low-income students. For schools and students, spending is assigned based on districtwide per pupil spending (i.e., no targeting). District means are weighted by ADA, and student and school means are weighted by enrollment. Districts with ADA less than 250 are excluded. Districts with greater than 500 percent or less than 20 percent of California mean spending or funding formula revenues per pupil are excluded. See Technical Appendix A for further detail on sample restrictions.
Progressivity in Spending Comparable to pre-Great Recession
Viewed over the longer term, the current levels of spending progressivity are comparable to the levels reached just prior to the Great Recession. In the years before the Great Recession, spending in high-poverty districts was roughly $2,500 to $3,000 higher than in low-poverty districts. Mainly due to disproportionate impacts of the recession on higher-poverty districts (Lafortune, Mehlotra, and Paluch 2020), this difference dropped over subsequent years to under $1,800 per student in 2013–14, before rising rapidly again as LCFF was implemented and reached full funding with the state’s improved economic situation.
The same pattern is true when measured at the school and student levels. Thus, while LCFF represents an unprecedented shift in California school finance towards more equitable funding based on student need (Putnam-Walkerly and Russell 2014), when we include formula and non-formula revenue sources, it has generated only modestly greater increases in spending progressivity than those that existed before the recession.
Districts Partially Target Spending to Schools
Unfortunately, no comprehensive statewide financial information exists that explicitly details how and where supplemental and concentration grant funding is spent. Figure 5, earlier, does not show how districts actually spend on their students and schools, and may therefore understate the extent to which low-income or high-need students receive additional resources under LCFF.
Local Control and Accountability Plans are intended to account for the funding and services provided for high-need students, but these are often incomplete and unclear, making it difficult to use them to understand how districts use supplemental and concentration funds (Alejandre and Massaro 2016; Howle 2019). Previous research has attempted to use staff demographic and salary schedule data to estimate school-level spending on teachers and other certificated educators, but this is only a partial accounting of spending (Lafortune 2019).
We gained important new information in the data on school-level spending for 2018–19—data required under the federal Every Student Succeeds Act (ESSA). We can use this information to gauge differences in spending across schools of varying need, and to determine whether districts are targeting supplemental and concentration grant funding to the schools where high-need students are enrolled.
Comprehensive data on school-level spending are available for 76 percent of districts, representing 86 percent of the state’s total K–12 enrollment in 2018–19. Per-student spending is separated into two categories: spending at the site level (e.g., teacher salaries, other staff, instructional materials) and central spending (e.g., central administrative staff, districtwide contracts). The data then break down these expenditures by funding source, whether from state and local funding (e.g., LCFF, but also including other local and state sources), or from federal funding (e.g., Title 1 funding, National School Lunch Program funding).
School-site Spending Is Higher in Concentration Districts
Because we are interested in how LCFF dollars are distributed, here we focus only on site-level and central expenditures that are not federally funded. Technical Appendix A reports additional details on the data and sample restrictions used in the subsequent analyses.
If we compare school-site spending by districtwide need, we see that site-level spending is higher in concentration districts. However, concentration schools in low-need districts spend less than similar schools in higher-need districts (Technical Appendix Figure D4). Notably, concentration districts with 55–80 percent high-need students target dollars to their neediest schools—but this does not appear to be the case in very high concentration districts (80%+) nor in non-concentration districts.
These patterns are less consistent when we examine total spending, including districtwide central expenditures. Differences in the level of central spending across districts mean that when we compare average spending levels by school, the ESSA data cannot provide direct evidence on whether or not districts are targeting spending to their higher-need schools.
Additional Funding Partially Targets School Sites
To understand the extent to which districts target LCFF supplemental and concentration dollars to higher-need schools, we need to compare relative spending levels within the same district. To do this, we rely on the share of high-need students at each school and use the funding formula to compute the number of supplemental and concentration (hereafter S&C) dollars generated by the students at each school. We then compare how much site-level spending increases at a school for a $1 increase in S&C dollars for schools within the same district, controlling for any differences in enrollment across grade levels to account for differences in spending that may be driven by different ages of students served. For further details on the exact regression specifications used, see Technical Appendix C.
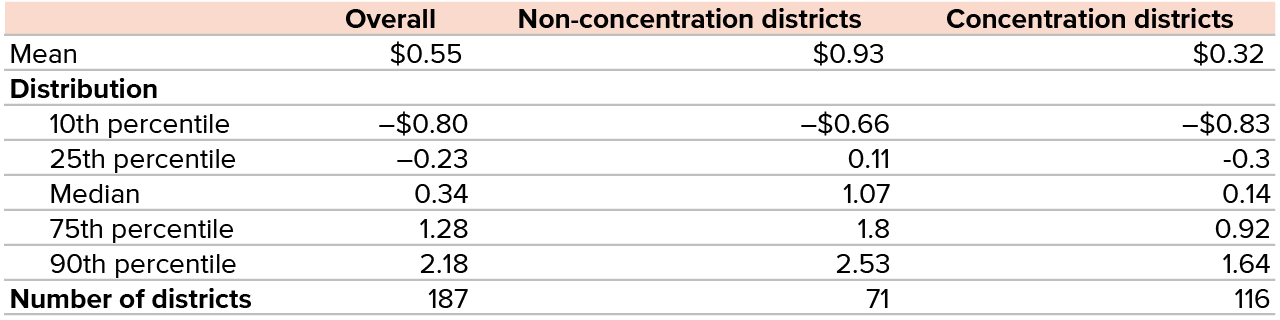
Statewide, for each dollar of S&C funding generated by a school, its site-level spending increases by 55 cents. This implies that on average, districts are mostly, but not fully, targeting their S&C dollars to the school sites that generate them. However, this varies considerably across districts, with many spending more at high-need school sites than the S&C funding generated at that site (i.e., progressive spending), while a minority of districts actually spend more on their lower-need schools than on higher-need schools (i.e., regressive spending).
On average, districts spend 55 cents of every dollar of S&C funding generated at a school site, though this amount is mainly driven by non-concentration districts, which spend 93 cents at a site compared to 32 cents for concentration districts (Table 2). In other words, the average concentration district allocates funding more evenly across its schools. However, even within these categories there is significant variation. The median concentration district spends about 14 cents more at the school site per dollar of additional S&C funding the site generates, while non-concentration districts spend a median of $1.07 more per dollar of additional funding.
The fact that within-district targeting of S&C dollars is more apparent at non-concentration districts is unsurprising. For one, these districts receive only supplemental grant funding, and this adds up to generally small increases under the formula. Moreover, given that most schools in concentration districts are majority high-need, districts may target spending and resources less across school sites. This is despite the fact that we should see higher spending in a 90-percent high-need school than in a 60-percent high-need school if districts spend dollars in proportion to where they are generated.
School site spending increases by 55 cents for every dollar of LCFF Supplemental and Concentration funding
SOURCES: California Department of Education, ESSA school site spending reports, LCFF Funding Snapshot 2018–19, school enrollment files; Authors’ calculations.
NOTES: Table reports the distribution of district-level estimates of the relationship between school site spending and school supplemental and concentration funding per student. Percentiles are based on district-level estimates of supplemental and concentration funding targeting. See Technical Appendix C for full specification and details. Estimates are produced only for districts with 10 or more school sites. Districts where school-site spending is not reported for more than 5 percent of student enrollment are excluded. Schools with fewer than 50 students are excluded. See Technical Appendix A for further details on the data and sample restrictions.
Notably, a significant number of districts actually have negative relationships between spending and S&C funding, meaning that many districts are spending more on their lower-need schools than their higher-need schools. Overall, the 25th percentile of this relationship is -0.23: in 25 percent of districts with 10 or more schools, each additional dollar in funding generated by a school under LCFF is associated with at least 23 cents less in spending than what the school generates in S&C funding. On the other hand, a significant number of districts spend more progressively across schools than implied under the formula; the 75th percentile across districts is $1.28.
There are two important caveats to these analyses. First, these comparisons exclude central spending, which is allocated equally across schools in the same district in the ESSA data. However, this equal use may not be the case in practice: a district may purchase services or hire educators that come out its central budget and are not specifically tied to any single site, but which nonetheless may be targeted to specific students or school sites.
For example, if a district hires a math coach to help students struggling with math across many schools, this might show up as a central expense even if it explicitly ends up being targeted to students who need additional help, and who are more likely to be “high-need” under the LCFF formula. Thus, to the extent that districts record some S&C dollars as central expenditures but actually target high-need students and school sites, the estimates in Table 2 may understate the extent to which S&C dollars are targeted, and vice versa. However, this classification has a limited impact on targeting overall: on average, 32 percent of a school’s (non-federal) expenditures are centrally allocated.
Second, districts may spend all S&C dollars at the school sites that generate them, but have different and non-equal patterns of spending from other funding sources across schools. However, given that most districts spend less than one dollar per extra dollar of S&C funding generated at a site, this would imply that districts regressively spend their other funding sources (spending less on high-need students), thereby limiting the ability of LCFF to achieve greater equity in distributing resources to higher-need school sites.
Thus, this distinction is less important in practice: if districts are strictly spending S&C dollars on their high-need students, but are using them to supplant rather than supplement primary funding sources, high-need students still do not see the full extent of increased resources expected under the formula.
Finally, the largest expenditure for school districts is staffing, specifically teachers and other educators. Whether a district can target funding across school sites, and to high-need students in particular, depends on their ability to hire and retain staff at high-need school sites. Given that higher-need school sites tend to have lower-paid teachers—due to having less-experienced teachers, on average—progressively funding school sites often means that districts have lower pupil-teacher and other pupil-staff ratios at their higher-need school sites (Lafortune 2019; Lee, Fuller, and Rabe-Hesketh Forthcoming). Thus, even where districts target spending to high-need school sites per LCFF’s intent, gaps in teacher experience and other characteristics across lower- and higher-need school sites may work against narrowing gaps in student outcomes.
LCFF Revisions Will Benefit Highest-Need Districts
The 2021–22 Budget Act includes a number of new funding streams for K–12 education, and one of the most notable is funding to increase the concentration grant from 50 percent to 65 percent (see Figure 1). Districts must use the increased portion of the concentration grant (i.e., the 15-percentage point increase) to fund new staff expenditures that provide direct services to students, a new restriction on how districts can spend increased LCFF funding.
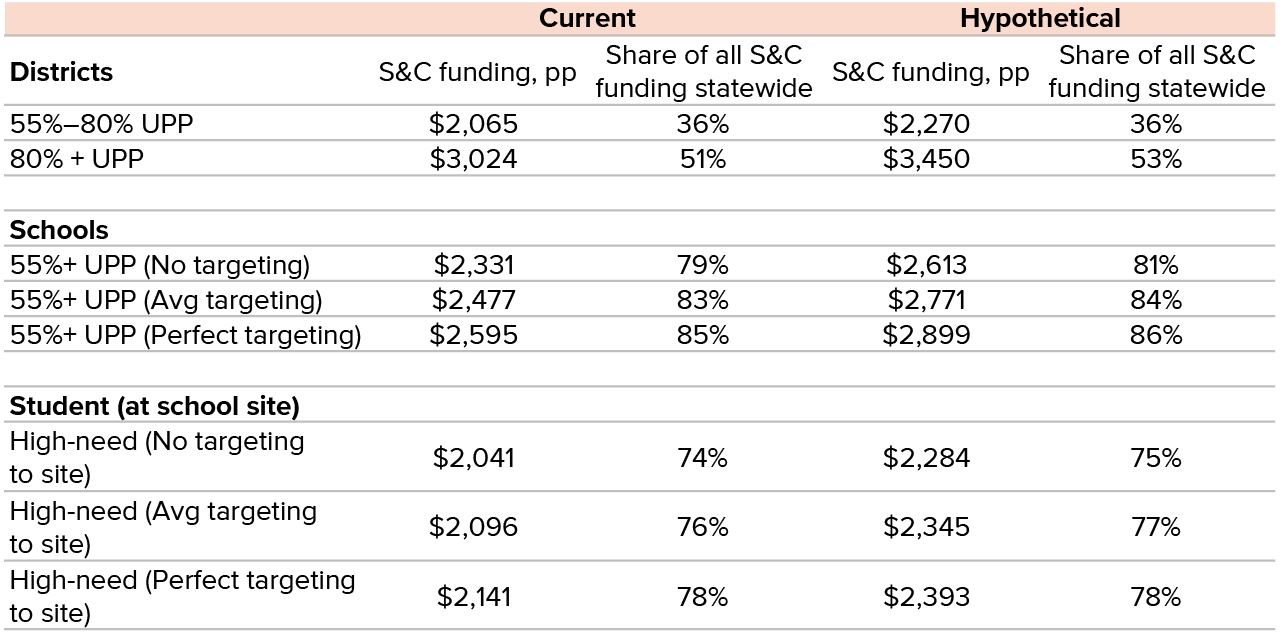
How these funds will be used and targeted remains to be seen. However, using data on LCFF funding and demographics from the 2019–20 fiscal year—and using estimates of within-district targeting discussed above —we can simulate and examine the impacts of this change on S&C funding across high-need districts, schools, and students (Table 3).
As expected, high-need districts ($200 per pupil) would gain a modest boost while highest-need districts ($425 per pupil) would get a much larger boost from the increased concentration grant. Roughly 51 percent of all S&C funding is allocated to these highest-need districts, and this share would increase slightly, to around 53 percent.
However, the amount of S&C funding for high-need schools and students depends on how funding is targeted within the district. The average concentration school will see roughly $280 to $305 more per pupil under the new formula, depending on the level of within-district targeting—slightly higher than the difference between the S&C funding under perfect targeting versus no targeting. Assuming that district targeting to school sites is of the same magnitude as estimated above and reported in Table 2, S&C funding for high-need students would rise from $2,096 to $2,345—roughly $250 more per pupil.
Highest-need districts would see the largest funding increases from higher concentration grants
SOURCES: California Department of Education, ESSA school site spending reports, LCFF funding summary 2019–20, school enrollment files; Authors’ calculations.
NOTES: “Current” refers to spending levels in 2019–20. “Hypothetical” incorporates the 2021–22 concentration grant changes into 2019–20 spending levels. Based on funding levels per district from 2019–20. Only districts with non-missing enrollment, UPP data, and LCFF funding summary data are included. No targeting assumes equal per student distribution of S&C funding across school sites. Average targeting assumes per student targeting of S&C funds to school site based on statewide estimates from ESSA data (Table 2). Perfect targeting assuming S&C funding is allocated equally to all high-need students, at the school site they attend.
Spending at Schools Varies by Race, Test Scores
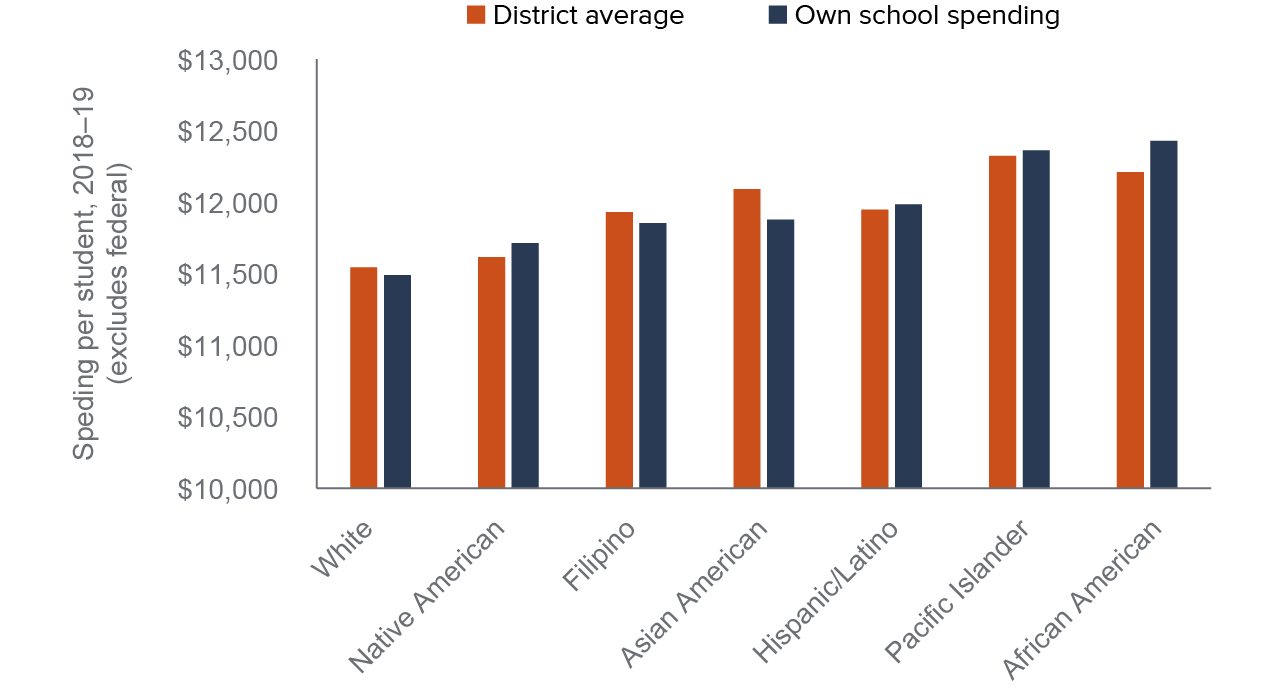
To this point we have examined how LCFF targets funding to students who are high-need—the legislatively required dimension. However, the formula may affect inequities in spending by student race or prior achievement, which can depend on how districts allocate resources across schools and on how high-need status correlates with these student groups. Figure 6 relies again on ESSA school spending from 2018–19, and reports the district average and school-level spending (site plus central) from non-federal sources for the typical student of the seven largest student racial/ethnic student groups in the state.
School spending is highest at districts and schools attended by African American students
SOURCE: California Department of Education, ESSA school site spending reports, school enrollment files; Authors’ calculations.
NOTES: Figure reports average school-site plus central spending per pupil and district average school-site spending from state and local sources, by student demographics. Districts where school-site spending is not reported for more than 5 percent of student enrollment are excluded. Schools with fewer than 50 students are excluded. See Technical Appendix A for further details on the data and sample restrictions.
Excluding federal sources, spending is highest among African American and Pacific Islander students, and lowest among Native American and white students. The typical African American student is in a district that spends on average $12,200 across its school sites, and attends a school that spends over $12,400. For Native American, Pacific Islander, Hispanic/Latino, and African American students, spending is higher at their own school than at the average school in their district. This difference suggests that within-district, additional funding is targeted to students in these racial groups, versus Asian American, Filipino, and white students.
Given that student groups who receive additional funding are more likely to be low-income or English Learners (and therefore designated high-need under LCFF), differences across race are both a function of districtwide funding under LCFF as well as the partial targeting of funds to higher-need schools within districts (Table 2). Thus, while LCFF does not explicitly target race, the ESSA spending data for 2018–19 show that, in particular, spending is greater for African American, Hispanic/Latino, and Pacific Islander students than students of other racial groups, both across and within districts.
Similarly, if we compare spending by student test scores on the 2018–19 Smarter Balanced exams (SBAC), we see districts spend at higher levels at schools where students have the lowest scores in English Language Arts (ELA) and math—those who were far below grade-level standards—than where students nearly meet (level 2), meet (level 3), or exceed (level 4) standards. These differences are more modest than those by race or student income; the average student who does not meet standards in ELA and math (level 1 or level 2) is in a school that spends roughly $250 and $350 more per student, respectively, than the average student who exceeds standards.
LCFF does not target student achievement explicitly; rather, this difference in funding is entirely due to the correlation between test scores and the high-need demographic groups that LCFF targets. Policymakers in recent years have suggested mechanisms to provide additional funding targeted to students based not on demographics but on student academic performance—for example, by designating students not meeting standards as high-need under the formula.
School spending is highest in schools and districts where students have lower test scores

SOURCE: California Department of Education, ESSA school site spending reports, school enrollment files, California Assessment of Student Progress and Performance research files; Authors’ calculations.
NOTES: Figure reports average school-site and central spending per pupil and district average school-site spending from state and local sources, by student proficiency on the 2018–19 SBAC exams in ELA and math. Districts where school-site spending is not reported for more than 5 percent of student enrollment are excluded. Schools with fewer than 50 students are excluded. See Technical Appendix A for further details on the data and sample restrictions.
Trends in Student Success
LCFF led to a more equitable distribution of funding; however, more equitable funding is only a means to an end. Ultimately, the success of the formula is determined by the extent to which changing the distribution of state funding changes student outcomes. Simply put, has funding translated into greater student success? Has it narrowed gaps in test scores and other outcomes between more- and less-affluent students, and by student race/ethnicity?
Existing research provides some guidance as to what one should expect. Although policymakers and researchers have long debated the relationship between school spending and student outcomes, recent research using better data and statistical techniques has consistently documented a causal link between increased funding and improved student outcomes (Jackson 2018).
Specifically, increased school funding has been shown to increase test scores (Lafortune, Rothstein, and Schanzenbach 2018; Brunner, Hyman and Ju 2020; Baron 2021), graduation, and college attendance (Jackson, Johnson, and Persico 2016; Candelaria and Shores 2019), and eventual adult earnings and economic mobility (Jackson et al. 2016; Biasi 2019). Moreover, aggregations across studies suggest that these effects are larger in lower-income districts and for lower-income students (Jackson and Mackevicius 2021). Indeed, research on the first few years of LCFF documented sizable increases in 11th-grade test scores and graduation rates from the funding increases under the formula (Johnson and Tanner 2018).
In this section, we attempt to build on this existing evidence and examine how much test scores, graduation rates, and A–G completion rates have improved due to the additional funding provided to many districts under the formula. We ask two related, but distinct questions. First, have overall levels and gaps in these outcomes across students improved since LCFF? Second, has the more equitable distribution of funding under the new formula improved student outcomes in the districts that received additional funding?
The distinction here is important; depending on how effectively the formula targets student-level need—and how districts allocate resources across schools and students—it is entirely possible for increased funding to reduce gaps between districts but not between students. National evidence on state-level school finance reforms suggests that relative funding increases between high- and low-income districts reduced gaps in test scores between these districts, but not between students, likely due to the imperfect targeting of additional resources (Lafortune et al. 2018).
Graduation and A–G Completion Rates Improved
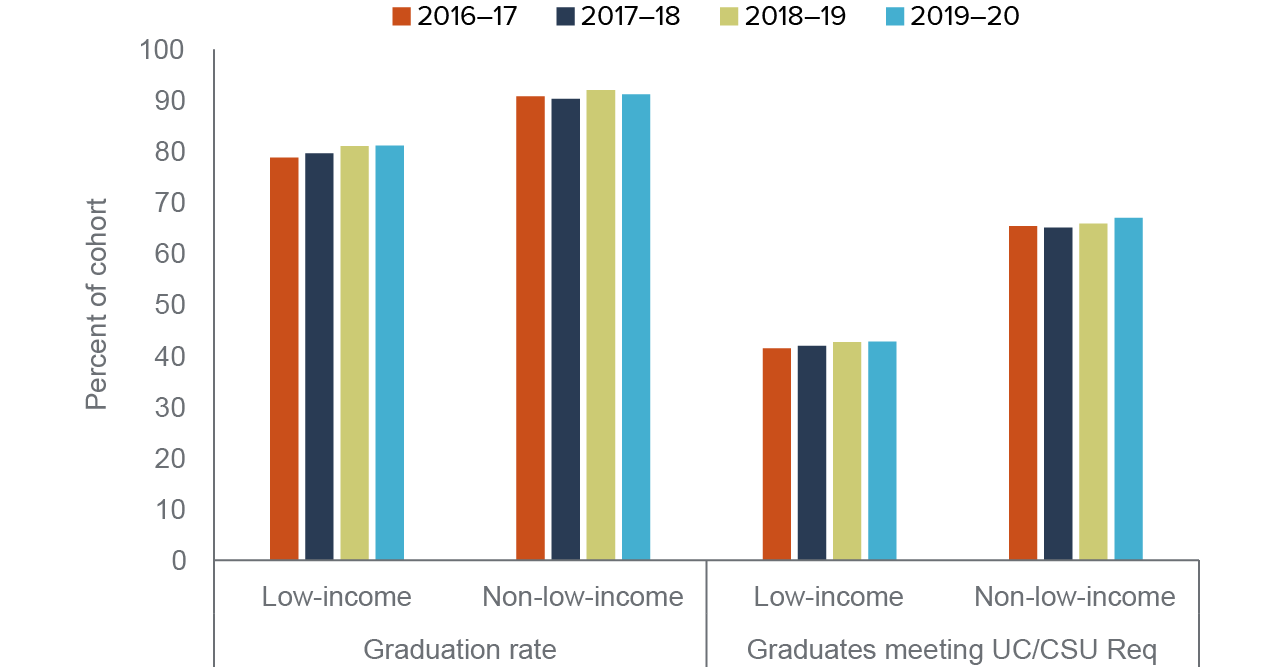
The share of California students graduating from high school has slowly increased in recent years, rising from 82.7 percent in 2016–17 to 84.3 percent in 2019–20. However, there are notable gaps in these rates by student income and race; in 2019–20, 81 percent of low-income students graduated high school, compared to 91 percent among non-low-income students (Figure 8). Encouragingly, this gap in graduation rates has fallen by nearly 17 percent over the past four years, from 12 percentage points in 2016–17 to 10 percentage points in 2019–20.
Low-income students saw a small rise in graduation rates
SOURCE: California Department of Education, DataQuest; Authors’ calculations.
NOTES: Figure plots the statewide adjusted cohort graduation rate (ACGR) and the share of graduates meeting UC/CSU requirements, which we use as a proxy for the A–G completion rate. Low-income refers to economically disadvantaged students, per the California Department of Education’s definition. See Technical Appendix A for more information on data sources.
While the vast majority of California’s high school students graduate, only about half of these graduates complete A–G requirements. In recent years, many districts have adopted an A–G requirement for graduation (Gao, 2021). However, gaps in A–G completion by income are larger than the gaps in graduation rates. The share of graduates completing A–G requirements has increased by roughly 1.5 percentage points over the past four years, but this rate of increase has been nearly identical for low-income and non-low-income students, meaning there has been little progress on these gaps.
A–G Completion Rates Increased More in Higher-Need Districts
While graduation rates and gaps between students may have improved—but gaps in A–G completion have not—this improvement may or may not suggest a causal impact related to more LCFF funding for high-need students. To examine the effect of the funding formula itself, we need to zoom in and examine outcomes in districts of varying levels of need, which see different funding levels under LCFF.
To do so, we employ a “differences-in-differences” approach and compare the relative trajectories of concentration districts to non-concentration districts, before and after LCFF. Under an assumption that outcomes trended in parallel before LCFF—and would have after 2013–14 in the absence of LCFF—we can interpret any relative differences in graduation and A–G completion rates between districts that saw larger or smaller funding increases as the effect of the formula. The fact that trends in funding and spending were similar across districts of varying need prior to LCFF provides some support for this assumption (Lafortune 2019).
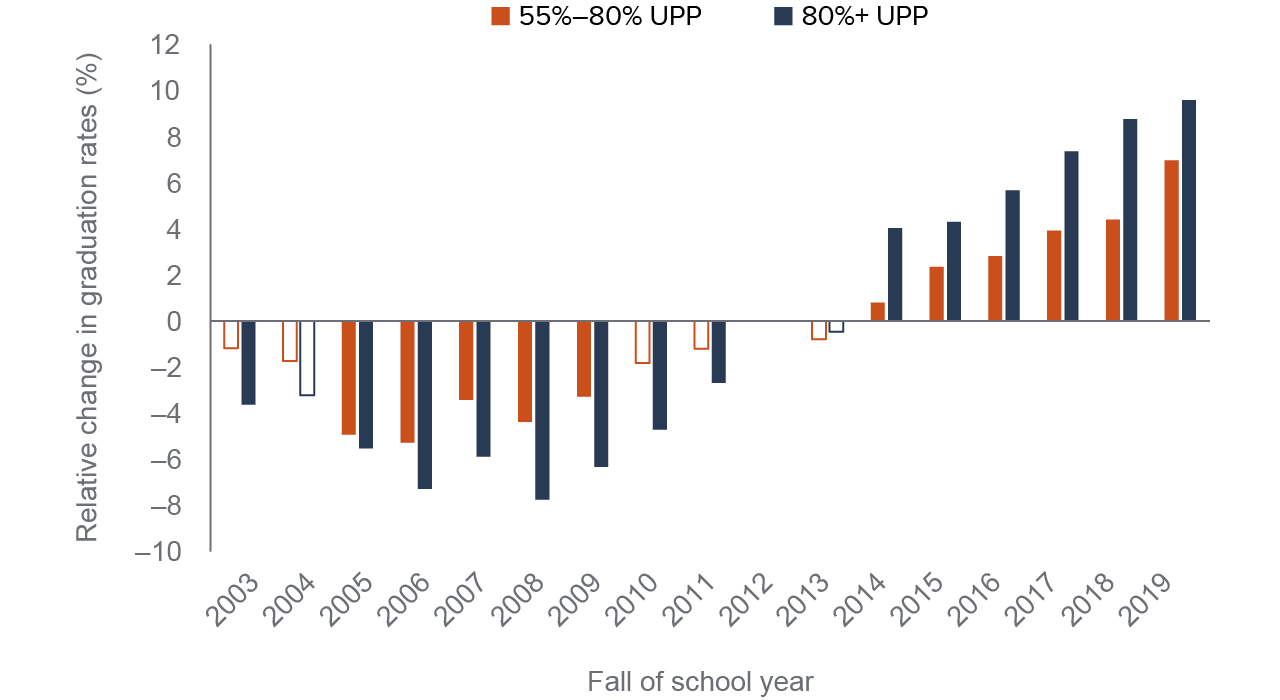
Figure 9 reports these estimates for A–G completion rates in concentration districts, separately for 55–80 percent and 80+ percent high-need districts. Estimates are relative to non-concentration districts, which saw much smaller increases in per student spending, as shown earlier (Figure 3).
In the decade prior to LCFF, differences between concentration and non-concentration districts were small and not statistically distinguishable from zero. Only in the years following LCFF do we begin to see an upward trend in A–G completion rates for concentration districts, relative to non-concentration districts. After a decade of a stagnant gap, the highest-need districts that received the largest funding increases under LCFF saw steady improvement, closing the gap in A–G completion relative to non-concentration districts by 9 percentage points (statistically significant). By comparison, the effect for the high-need districts (55%–80%) was 5 percentage points nine years after LCFF was first implemented (statistically significant).
A–G completion improved faster in concentration districts than non-concentration since LCFF

SOURCE: California Department of Education, enrollment and graduates files; Authors’ calculations.
NOTES: Solid bars denote statistical significance at the 5 percent level; hollow bars denote statistically insignificant estimates. Figure reports differences-in-differences estimates for A–G completion rate, separately for high-need (55%–80%) and very high-need (80%+) districts. Estimates are relative to 2012–13, which is excluded. Estimates control for enrollment by grade, racial/ethnic shares, share eligible for free or reduced-price meals, for time-invariant district characteristics, and for differences across years. Standard errors are clustered by district. See equation (1) in Technical Appendix B for the full specification.
The impact of LCFF is less conclusive when we estimate graduation rates: differences in graduation rates between concentration and non-concentration districts actually increased prior to LCFF in the mid-2000s, and then this gap fell slightly in the five years prior to LCFF (Figure 10). Changes in statewide graduation policy may partially explain this increasing—and subsequent narrowing—of the gap between more- and less-affluent districts in the decade prior to LCFF.
Graduation rates improved faster in concentration districts, but trend pre-dates LCFF
SOURCE: California Department of Education, enrollment and graduates files; Authors’ calculations.
NOTES: Solid bars denote statistical significance at the 5 percent level; hollow bars denote statistically insignificant estimates. Figure reports differences-in-differences estimates for graduation rates, separately for high-need (55%–80%) and very high-need (80%+) districts. Estimates are relative to 2012–13, which is excluded. Estimates control for enrollment by grade, racial/ethnic shares, share eligible for free or reduced-price meals, for time-invariant district characteristics, and for differences across years. Standard errors are clustered by district. See equation (1) in Technical Appendix B for the full specification.
Starting with the 2006 graduating class, the state required that students pass an exit exam (California High School Exit Examination, or CAHSEE) in order to graduate from high school. Consistent with research documenting disproportionate impacts on minority and low-achieving students (Reardon and Kurlaender 2009), gaps between higher- and lower-need districts increased, especially in the first few years. The state eliminated CAHSEE as a requirement for graduation in 2015, shortly after passing LCFF.
Given differential trends prior to LCFF, it is unclear whether the rise in graduation rates after LCFF represents the effect of the funding formula, continued trends that pre-date LCFF, changes in graduation policies (e.g., CAHSEE), or other factors that disproportionately affect higher-need districts. Thus, while we cannot conclude that graduation rates rose in concentration districts due to additional funding under LCFF, the fact that gaps in graduation rates are closing—by both student-level and district-level need—is nevertheless an encouraging sign for California’s education system.
More Students Are Meeting Test Standards
Steady, gradual improvements in graduation rates and A–G completion reflect important progress for California high school students. How are outcomes evolving for younger students in earlier grades? We next examine test scores on the Smarter Balanced Assessment (SBAC) and the California Standards Exams (CST), for students in grades 3–8, and grade 11.
Test Score Gaps Narrowed more by District than Student Need
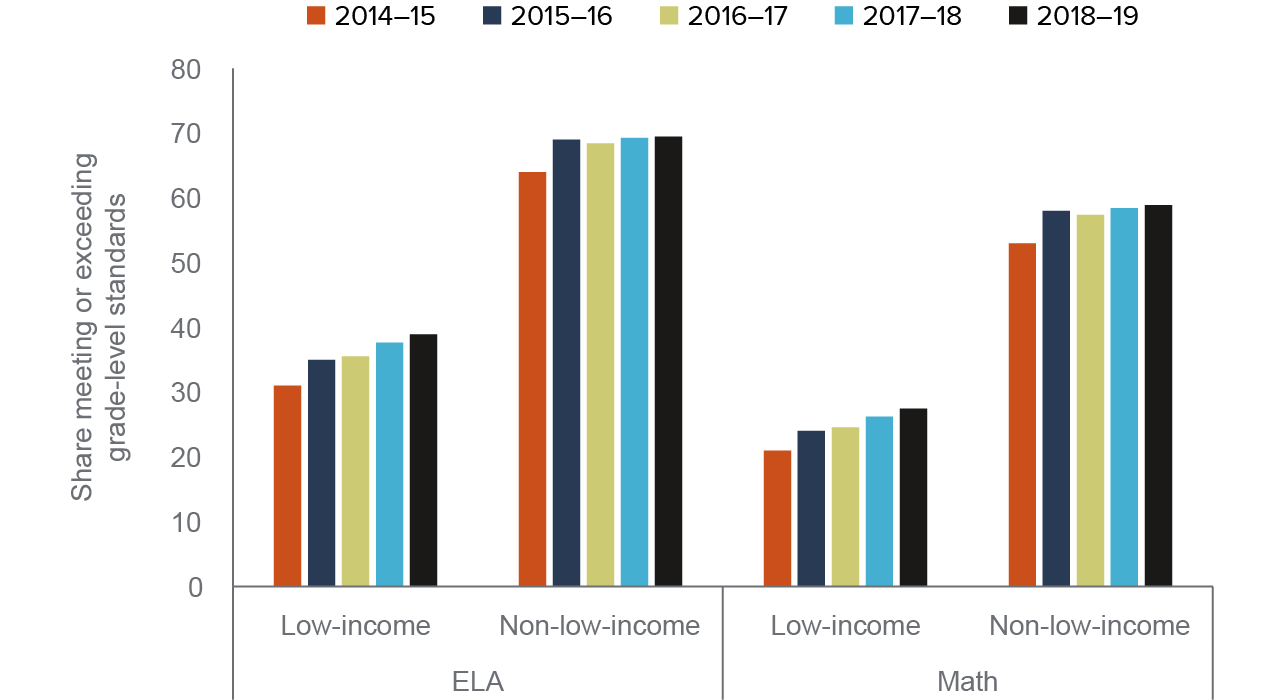
Comparing the share meeting or exceeding grade-level standards for low-income and non-low-income students reveals modest increases for both groups, but larger ones among low-income students (Figure 11). In 2014–15, the first year SBAC was administered, only 31 percent of low-income students met or exceeded standards in ELA, compared to 64 percent of non-low-income students. For math, the gap was similar but the share meeting standards was even lower: only 21 percent of low-income students, and 53 percent of non-low-income students.
These gaps by student income narrowed slightly over the next five years, but they remain large. By 2019–20, the share of low-income students meeting or exceeding standards increased by 8 percentage points in ELA and 6.5 percentage points in math. Non-low-income students also saw progress, but at a slower rate: a 5.5 percentage point increase in ELA and a 5.9 percentage point increase in math. This implies the gap in proficiency is narrowing between low-income and non-low-income students by nearly 8 percent in ELA (2.5 percentage points) and 2 percent in math (0.6 percentage points). Also, the share of low-income students who were far below standards also fell notably. The income gap in the share far below standards dropped by nearly 16 percent in ELA and 7 percent in math, suggesting that schools have had greater success at improving outcomes of the students far below grade level in recent years (Technical Appendix Figure D5).
Low-income students had modest but consistent increases in ELA and math test scores
SOURCE: California Department of Education, California Assessment of Student Progress and Performance research files; Authors’ calculations.
NOTE: Figure plots the statewide share meeting or exceeding grade-level standards on the SBAC, in ELA and math, for low-income and non-low-income students. Low-income refers to economically disadvantaged students, per the California Department of Education’s definition. See Technical Appendix A for more information on data sources.
Recall that nearly 20 percent of high-need students are in non-concentration districts, while just under half (43%) of the state’s non-high-need students are in concentration districts (Table 1). Moreover, the data in Figure 8 contrast academic success by student income and not high-need status, though income is a key component of high-need and the two are very highly correlated. Assessing the impact of additional funding under the formula therefore requires comparing outcomes by district, where the funding is targeted.
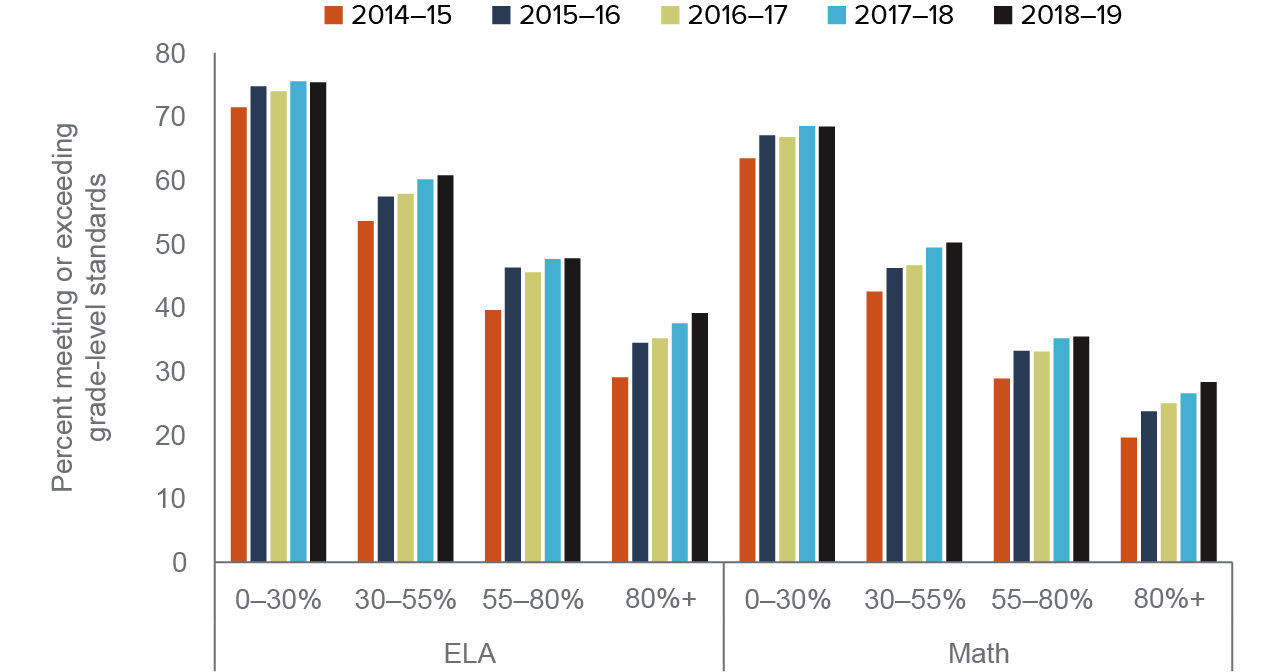
The greater the share of high-need students in a district, the lower the share of students meeting or exceeding standards in both math and ELA. However, growth in both math and ELA since 2014–15 was higher in these higher-need districts as well, resulting in a narrowing of gaps across districts. Figure 12 compares test scores by year for districts with different shares of high-need students with different funding increases. For example, at the highest-need districts the share meeting or exceeding standards increased by 10 and 9 percentage points in ELA and math, respectively, while at lower-need districts the share increased 4 and 5 points.
Highest-need districts improved faster in math and ELA proficiency
SOURCE: California Department of Education, California Assessment of Student Progress and Performance research files; Authors’ calculations.
NOTE: Figure plots the share meeting or exceeding grade-level standards on the SBAC, in ELA and math, districts with different shares of high-need students. Low-income refers to economically disadvantaged students, per the California Department of Education’s definition. See Technical Appendix A for more information on data sources.
By percentage, these across-district gaps in the share of students meeting standards are closing faster than gaps by student income. The gap between the highest-need and the lowest-need districts (80% or higher UPP vs. less than 30%) fell by nearly 15 percent for ELA. For math, it fell by roughly 9 percent.
Consistent with the fact that LCFF targets district and not student-level need, it should come as no surprise that improvements in test score gaps are larger when computed across districts rather than across students. This underscores an important consideration when using trends in student-level outcome gaps to assess the efficacy of LCFF supplemental and concentration funding: changes in these gaps are a function of the relationship between student-level need and district-level need, and how districts distribute the additional funding they are given. Seemingly slow progress does not necessarily mean that additional funding is ineffective; rather it could be due to the fact that funding is poorly targeted to student-level need, as has been the case in many school finance reforms in other states (Hyman 2017; Lafortune et al. 2018).
Concentration Grants Improve District Test Scores
Test scores have seen modest improvements, and in particular, improvements have been much greater in the state’s highest-need districts. These trends over the past five years on SBAC suggest that additional LCFF funding leads to higher test scores; but a more definitive statement about cause and effect requires an empirical design that can account for other changes unrelated to the funding change.
Unfortunately, the change from the California Standards Test to the Smarter Balanced Assessment in 2014–15 complicates our ability to examine longer trajectories, as we did for graduation rates and A–G completion. Specifically, California’s switch from CST to SBAC changed more than average scores; it affected the relative performance of different student groups: disparities in test scores by race and income increased in the first year under SBAC (Hill and Ugo 2016; Technical Appendix B). If, for example, some of this initial widening of the gap was due to a lack of familiarity with computer-adaptive testing, differences in Common Core curriculum, access to aligned instructional materials, or less “teaching to the test,” then a reversal of these trends may drive later narrowing in the gap, rather than the effects of LCFF funding itself.
To assess the causal effect of LCFF funding on test scores, we instead rely only on differences in test scores on the same exam in the same year. Recall that the funding formula has a sharp “kink” at 55 percent high-need, indicating a change in the relationship—or “slope”—between district share of high-need students and funding. Given that no such kink existed before LCFF, we can examine whether an analogous kink emerges post-LCFF in the relationship between student test scores and district share high-need. Any distinct change in the slope at the 55 percent threshold would therefore reflect the impact of the additional concentration grant funding per district.
The intuition of this approach can be seen in Figure 13. Before LCFF, a notable downward relationship existed between district need and the share of students meeting or exceeding grade-level standards, but there was no kink in the relationship near the 55 percent threshold. By 2018–19, a kink in the slope is visible at 55 percent, potentially indicating the efficacy of the additional concentration grant funding.
This pattern also holds when we use standardized scale scores rather than the percent who meet standards (Technical Appendix Figure B9). Though other changes may have affected the relationship between districtwide need and test score performance other than LCFF during this time, none are discontinuous at the 55 percent threshold besides the additional concentration grant funding provided. Based on this motivation, we then estimate the change in slope between district need and test score outcomes at the 55 percent threshold, across districts in each year, accounting for any differences due to enrollment, demographics, county, grade, and subject.
A “kink” emerged post-LCFF in the relationship between district high-need and student test scores
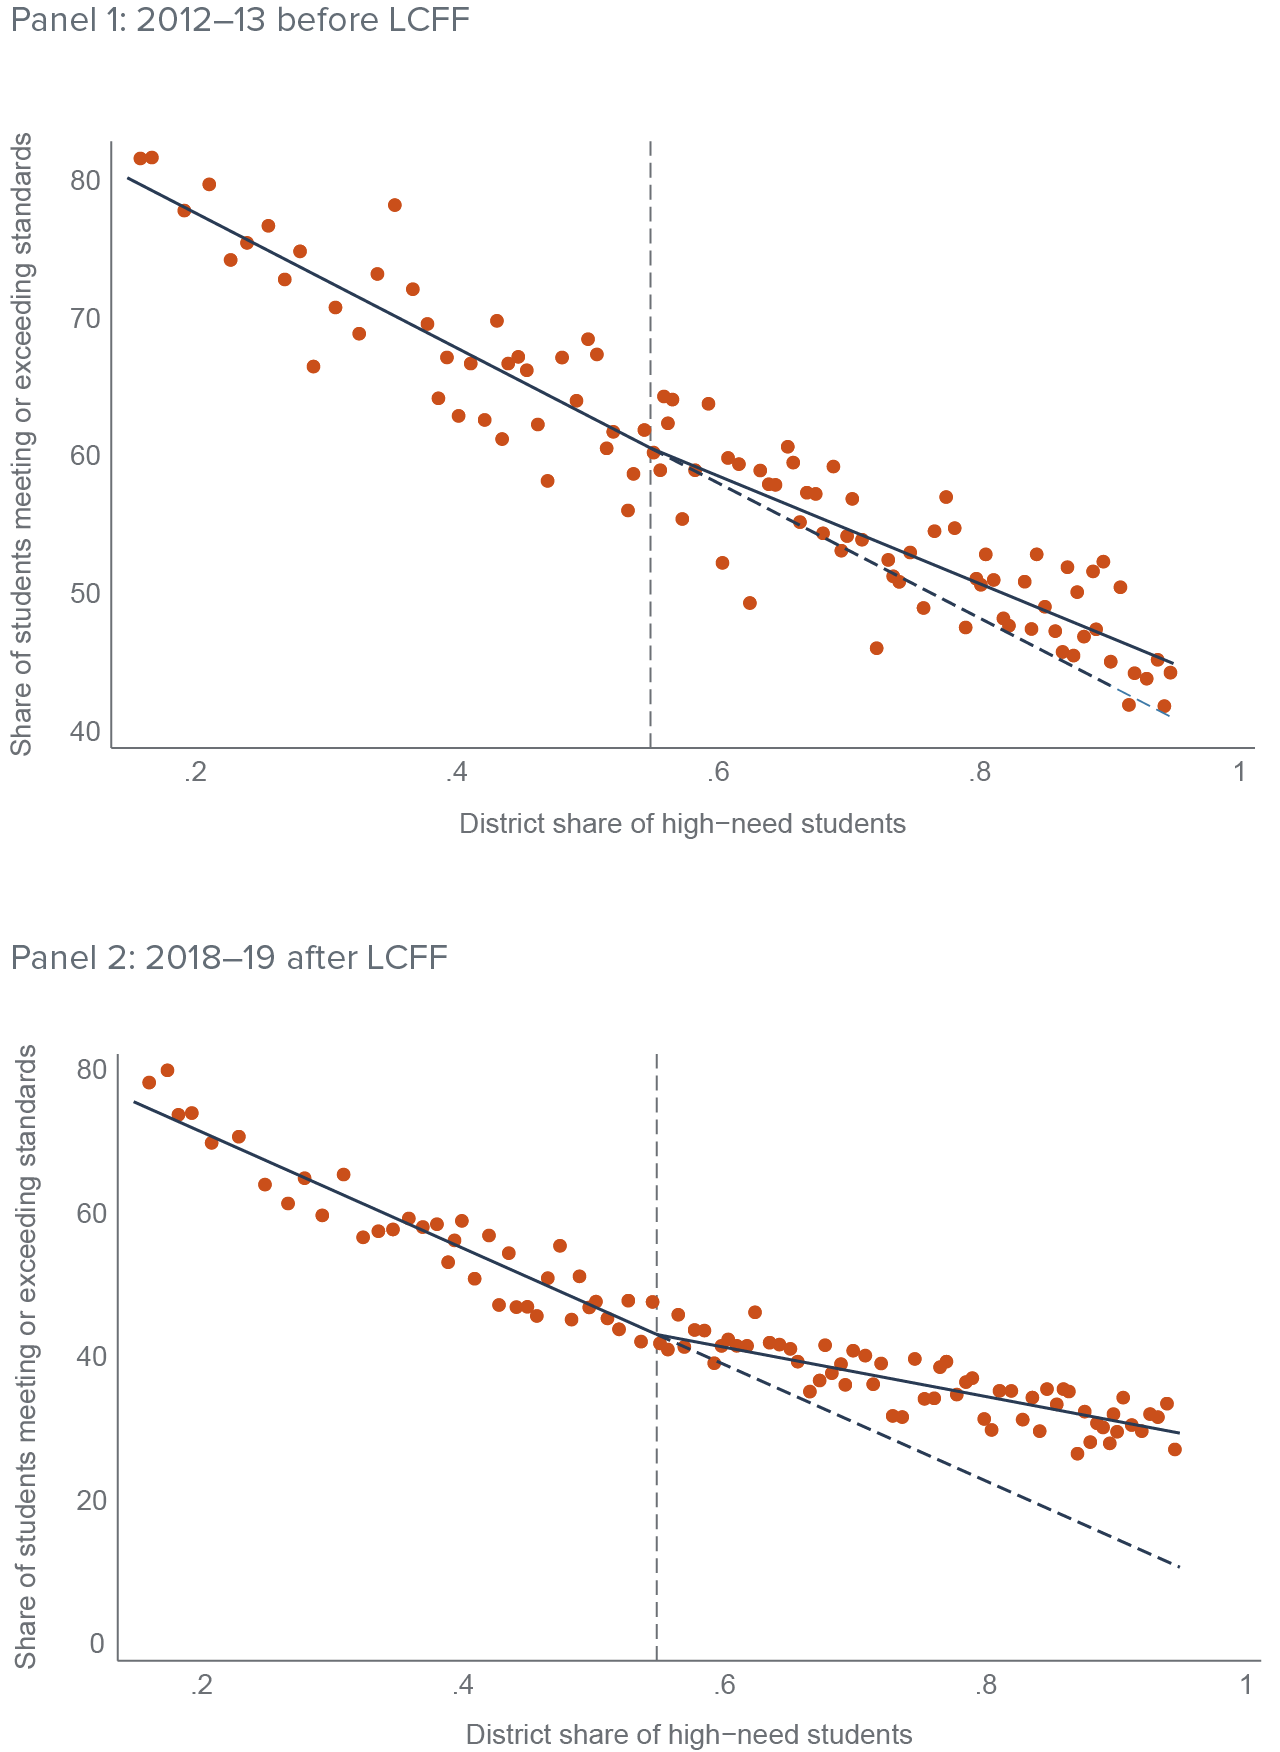
SOURCE: California Department of Education, California Assessment of Student Progress and Performance research files, enrollment files; Authors’ calculations.
NOTES: Each dot is a “bin” depicting the average share meeting or exceeding standards for multiple districts within a narrow range of share high need, the share meeting standards in 2012–13 (top panel), and 2018–19 (bottom panel). Only districts within 40 percent of the cutoff on either side are shown. For comparability over time, only test scores in grades 3–7 are included. Solid blue line displays the line of best fit above and below the 55 percent cutoff; the dashed blue line extrapolates the line of best fit from below the 55 percent cutoff. Each dot contains an equal number of district-grade-subject observations (unweighted); binned averages and lines of best fit are adjusted for average differences in the share meeting standards across grade-subject exams.
Figure 14 reports estimates from this approach by year, for the share of students who meet or exceed standards. As expected, estimates of the change in slope are small and not statistically significant prior to LCFF, indicating no discontinuous change in the relationship between test scores and district share of high-need students at the 55 percent threshold. Small and statistically insignificant effects in the first few years after LCFF are consistent with the gradual implementation of the funding formula, and with existing evidence that suggests effects of new spending sometimes take time to accumulate and lead to improved test scores and other academic outcomes (e.g., Lafortune et al. 2018; Jackson and Mackevicius 2021). By 2017–18 and 2018–19, effects are large and statistically significant, providing evidence that the concentration grant funding gradually led to improved outcomes.
How should we interpret the magnitude of these changes? First, the 2018–19 estimated change in slope is 36 percentage points: that is, for each additional percent of high-need students beyond 55 percent, the share of students meeting standards is 0.36 percentage points higher than if the slope of had remained the same past 55 percent. Second, the analogous change in slope for funding is $7,012 per student (Technical Appendix Figure B10).
In per-dollar terms, these two numbers taken together imply that $1,000 in additional concentration grant funding led to a roughly 5.1 percentage point (13% for ELA or 18% for math) increase in the share meeting standards. Effects are largest in elementary school and in 11th grade, though differences across grades are not statistically significant (Technical Appendix Table B2).
When we look by race, EL status, and school share high-need, we find the largest effects among Latino students, current and “Ever-EL” (defined as current and reclassified former ELs) students, and in concentration schools with above 55 percent high-need students. However, when looking at effects by student group we have less statistical precision, and therefore these differences are generally not statistically significant (Technical Appendix Table B4 and Table B5). Effects are more similar by subject, by student income, and by whether the school is high-need (55% or higher UPP) (Technical Appendix Tables B3–B5).
After LCFF, test scores improved faster in concentration districts
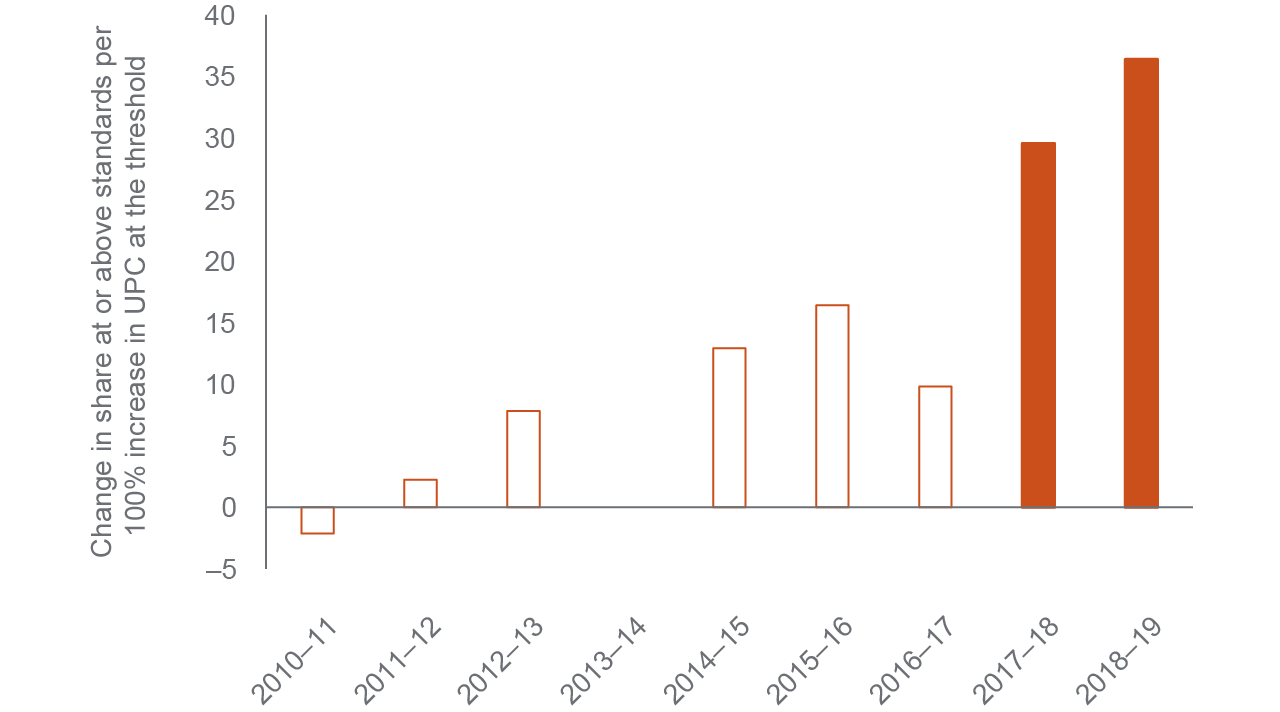
SOURCE: California Department of Education, California Assessment of Student Progress and Performance research files, enrollment files; Authors’ calculations.
NOTES: Solid bars denote statistical significance at the 5 percent level; standard errors are clustered by district. Figure shows estimates of the change in slope (kink) at the cutoff for test scores in standard deviation units, by year. See equation (2) in Technical Appendix B for the full specification. Year corresponds to fall year. 2013–14 was a transition year between CST and SBAC, and is excluded.
For reference, the difference in the share of students who met or exceeded grade-level standards in ELA between low-income and non-low-income students in 2018–19 was nearly 31 percentage points; the test score gap between the highest-performing racial group (Asian Americans) and the lowest-performing one (African Americans) was 44 percentage points. Gaps are similarly large across districts: the gap between the highest- (80%+) and lowest- (under 30%) need districts was roughly 36 percentage points in 2018–19, a decrease from a gap of approximately 42 percentage points in 2014–15.
In the absence of other changes, given greater funding of roughly $2,000 per student in the highest-need districts from 2015–16 to 2018–19, these estimates imply that concentration grant funding may be able to close much of these gaps in test scores if the relative funding increase is maintained for another 14 years. However, the margin of error on the test score estimates suggest a range of 8 to over 40 years. Nevertheless, these estimates are generally consistent with the pace of progress over the past 5 years; the same district-level gap closed by 6 percentage points, or 15 percent.
Improvements Are not yet Clear for English Learners
To this point, we have focused on outcomes by district need and student income. However, English Learners (ELs) are also a key student subgroup deemed high-need under LCFF. ELs are one of the lowest-performing student groups on state exams—and reclassified ELs are some of the highest-performing students—underscoring the importance of delivering effective services to these students to eliminate persistent educational inequities. Understanding their academic trajectories is key to assessing whether LCFF is delivering on its promise to improve equity in outcomes.
So far, the available data only suggest that LCFF leads to relative improvements among ELs or Ever-ELs, despite the modest gains made by low-income students more generally. Heterogeneity in the estimated test score effects suggest that effects are largest among EL and Ever-EL students, but these differences are not statistically significant. Scores for Ever-EL students saw modest improvement over the last five years—an increase in the share meeting standards of 8 percentage points in ELA and 7 percentage points in math—but non-EL students improved at a similar rate (Technical Appendix Figure D6 and Figure D7). However, improvements for current EL students were slightly smaller.
Lagging progress among current ELs could still be associated with improvement among those who were “ever EL” if more students successfully meet the requirements for reclassification. However, difference-in-difference estimates of the effect of concentration grant funding on reclassification rates show no differential change in reclassification rates in high-need districts (Technical Appendix Figure B5). The fact that aggregate test score gaps are stagnant or increasing, and there has been no differential improvement in reclassification rates among ELs in higher-need districts receiving more funding, suggests that LCFF is having little discernable statewide impact on the performance of ELs to date. However, changes in EL reclassification policies at the district and state level complicate the ability to draw any definitive conclusions from the available data on the relative efficacy of LCFF for improving EL outcomes specifically.
Policy Implications and Recommendations
Districts will face considerable challenges over the coming years as they attempt to recover from the pandemic. Significant new funding from state and federal sources means that effectively deploying additional resources will determine educational trajectories over the next decade. An important share of increased state funding will flow directly through the funding formula, and the 2021–22 budget also includes expanded concentration grants and expanded learning funding that will provide even larger funding increases for the state’s highest-need districts. Thus, as LCFF enters its ninth school year, policymakers must examine the extent to which the formula has improved the equity and efficiency of California’s public education system.
When evaluated across districts—especially when focusing on the highest-need districts—LCFF has led to a more equitable distribution of funding and outcomes. Spending has increased fastest in the highest-need districts, leading to a relative rise in graduation rates and test scores; additional concentration grant funding appears to raise A–G completion rates at districts that received the most funding; and due to concentration grant funding, standardized test scores improved in these districts at a magnitude consistent with prior research. Furthermore, the relative increase in funding of $2,000 per year for highest-need districts could close test score gaps across districts—but not across students—within the next decade, if effects do not diminish over time or have not widened substantially during the COVID-19 pandemic.
However, gaps by student groups experienced slower and less consistent improvements compared to gaps by district share high-need. Spending and resources for high-need students rise under LCFF based on how much districts allocate dollars to the students who generate them. Without targeted spending, the progressivity of the LCFF formula on per student spending is lower at the student and school level than at the district level.
For each additional dollar of supplemental and concentration grant funding generated by the students at a school, site-level spending increases by 55 cents. This indicates that LCFF funding for high-need students is mostly, but not completely, targeted to the school sites that generate it. Moreover, the allocation of spending across school sites varies greatly: targeting is roughly dollar-per-dollar in non-concentration districts, but much less so in concentration districts. More concerning, a nontrivial share of districts spend less at their high-need school sites that generate the most S&C funding.
Taken together, these findings suggest that LCFF notably affects funding, resources, and student outcomes in the highest-need districts—but that imperfect targeting of resources to high-need students within districts remains a concern. While this does not mean that LCFF dollars have been wasted or unproductive, it does dampen the efficiency and efficacy with which the funding formula can improve on inequities in outcomes across student groups. We propose three broad recommendations for policymakers seeking to improve LCFF’s ability to deliver on its promises of more equitable access to opportunities and outcomes:
Improve tracking and transparency of funding for high-need students. A significant share of supplemental and concentration dollars may not be reaching the school sites where the dollars are generated. Districts vary widely in whether and how much they target dollars consistent with LCFF’s policy intent. While federally mandated site-level data will be important for examining school spending patterns in the coming years, they are not intended to be a way to comprehensively account for LCFF funds. Despite recent improvements in transparency, many stakeholders still lack full information and understanding about how funding is allocated (Hahnel, Hough, and Willis 2020).
State policymakers should consider adopting required reporting mechanisms for funding down to the site level. While implementing and standardizing such a system would require significant new shifts in accounting practices for many districts—as well as funding, guidance, and technical assistance from the state—building new capacity and transparency in the system would enable stakeholders, policymakers, and researchers to ensure greater equity and efficiency in the tens of billions spent in California’s K–12 schools each year.
Consider funding mechanisms based on school site need. Imperfect targeting of supplemental and concentration dollars dampens how well LCFF can affect inequitable outcomes by student income, race, and language status, but the reliance on districtwide need is also important. Much of the additional funding under LCFF comes via concentration grants, but many concentration schools are in districts that do not receive this funding. Such schools miss out on significant sums—and this gap will only increase with future increases to the size of the concentration grant.
Designing a way to fund these school sites commensurate with their need would improve the overall targeting of the formula’s dollars to more of the state’s high-need students and schools. However, policymakers must be careful to ensure that any school-site funding mechanism does not create incentives for districts to further segregate schools to increase their funding levels.
Consider increasing supplemental grants and/or lowering the threshold for concentration grants. Districts with the highest shares of high-need students have seen the largest benefits from LCFF—both in terms of spending and student outcome improvements—and will see substantial increases in funding with the increased concentration grant funding in the enacted 2021–22 budget. However, a majority of the state’s high-need students are in districts that have a high-need share between 30 percent and 80 percent. Importantly, these districts have seen smaller spending increases than those that are 80 percent or higher high-need—and roughly similar spending increases as the state’s lowest-need districts.
Of course, districts with high concentrations of student need may require even higher levels of funding per high-need student; this in part reflects the theory of concentrated need underlying the original funding formula. Nevertheless, targeting additional funding increases to high-need students across a broader set of districts would further improve the formula’s ability to address gaps and inequities in student outcomes, as California’s high-need students are located across a variety of districts and local contexts.