
With rising state and local revenues—and significant one-time federal funds in 2020–21 and 2021–22—California policymakers now have greater capacity to invest in public schools. At the same time, longstanding racial and income disparities motivate calls to provide funding more efficiently and equitably. What insights does current research provide into using additional dollars to improve student outcomes?
- Multiple years of sustained higher spending for K–12 education leads to higher test scores, graduation rates, college attendance, and adult economic outcomes.
- School funding effects are generally larger when dollars target low-income students, and most consistently positive for spending on staff, materials, and operations. Results from facilities spending vary more.
- How funding is targeted—be it to students, schools, or districts—matters. The way districts spend across students and schools can influence the extent to which policies promote equitable outcomes.
- Spending on staff quantity and quality can be a tradeoff. Educator labor markets can also constrain policy: large-scale policies require schools to hire more teachers—as with class size reduction in the 1990s—but can mean teachers hired have less experience and fewer credentials, which may limit benefits for students.
How does California fund schools and how have funding policies changed?
For decades, California funded public schools primarily through property taxes, with some state and federal aid—until the California Supreme Court declared the system unconstitutional in Serrano v. Priest (1971).
Soon after, the state capped local property tax rates under Proposition 13 (1978), shifting the burden of school funding to the state government; per-student funding then fell behind the national average in the ensuing decades. Proposition 98 (1988) requires the state to spend roughly 40 percent of General Fund revenues on public K–12 schools (and community colleges).
In 2013–14, California overhauled school finance through the Local Control Funding Formula (LCFF), giving districts more flexibility and control over spending. Districts now receive a base grant per student and extra funding based on their share of high-need students: low-income, English Learner (EL), and/or foster youth.
How much could current funding levels close gaps?
English Language Arts test scores for eighth-grade students in 2018–19 show that over two-thirds of higher-income students met standards, compared to 37% of low-income students; there were also large gaps by race. These gaps have persisted for decades. If we extrapolate from the research, estimates imply it could take $7,200 to $10,200 more for low-income students annually for eight years to close test score gaps of this size. Currently the extra funding allocated to low-income students is 8% to 11% this amount.
Under LCFF, average spending is highest for low-income, EL, and Black students
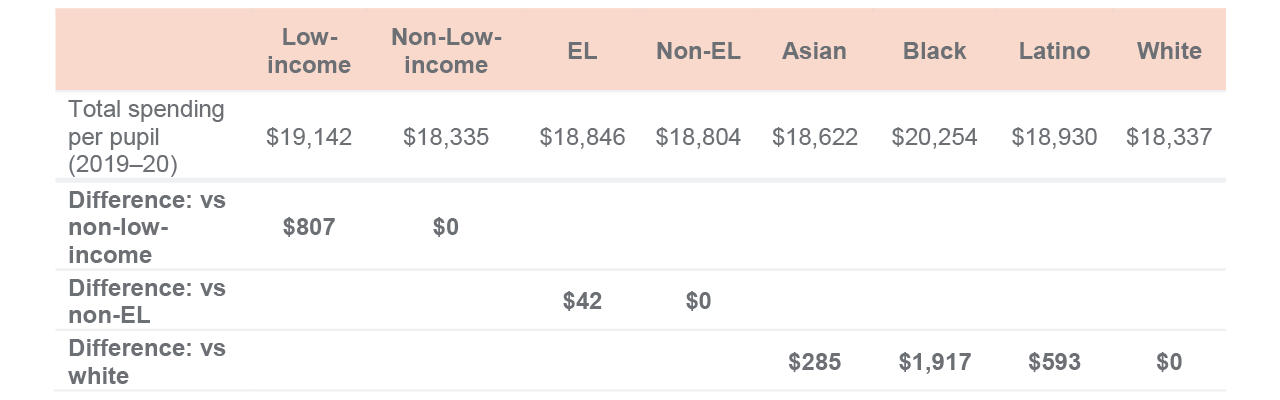
SOURCES: California Department of Education, SACS files, enrollment files; authors’ calculations.
NOTES: Low-income (vs. non-low-income) refers to eligibility for free or reduced-price meals. EL is English Learner. Inflation-adjusted amounts are reported (2020$).
Put differently, it would take 70 or more years to close income or achievement gaps at current progressivity levels—holding all else equal. These numbers are extrapolations, and do not predict how things will evolve nor prescribe a level of necessary funding. Other factors also affect test score gaps—such as COVID-19; furthermore, improvements to student outcomes may slow as spending goes up (though evidence does not suggest this is the case at current funding levels).
What factors can affect the efficiency of school funding?
Cost pressures affect the efficiency of funding—and district costs are rising faster than state funding. Changes to state pension systems and rising employee benefit costs have required districts to direct a larger share of their budgets to these areas.
Staffing shortages can limit how well funding translates into better school resources. And fewer staff, particularly in harder-to-fill subject areas, further combine with pressure to increase teacher salaries.
Declining enrollment has placed fiscal pressure on many districts, as state funding is tied to the number of students districts serve. Enrollment has plummeted since COVID-19, and California projects that most counties may lose students in coming years.
What insights are missing from research on school funding?
Most school spending research considers student test scores, graduation, and college attendance, which may not reflect the full benefits of typical spending or investments in other areas, such as student attendance, mental health, and social-emotional learning. Research is limited around this type of spending. Plans to launch a statewide longitudinal data system in California could help researchers, practitioners, and policymakers examine longer-term impacts and broaden the set of outcomes that define effective spending.