Nearly half of Californians have now received at least one dose of the COVID-19 vaccine. But ongoing vaccine hesitancy has posed a challenge for the effort to fully vaccinate the state’s population. In our April 2021 survey—which wrapped up on April 14, the day before the vaccine became available to all Californians age 16 and older—we gauged public sentiment toward getting the vaccine.
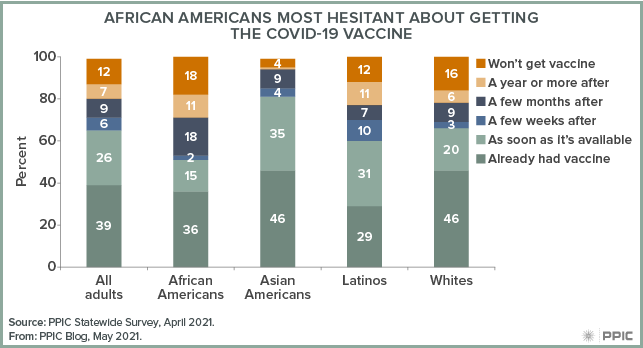
Overall, four in ten Californians (39%) report that they have already had the vaccine. One in four (26%) say they will get the vaccine as soon as it is available and 15% say they will get it either in a few weeks (6%) or a few months (9%) after it is available. One in five Californians are more hesitant, saying either they would wait a year or more after it is available (7%) or would not get the vaccine (12%).
The pandemic has had an outsized impact on people of color and lower income Californians. Even as California has gotten a better handle on the coronavirus, it has struggled with equitable vaccine distribution. At the same time, the historical roots of vaccine hesitancy among African Americans has received a great deal of examination. In our April survey three in ten African Americans said they would either wait a year or more (11%) or that they would not get the vaccine (18%), making them the most likely race/ethnic group to hold this view.
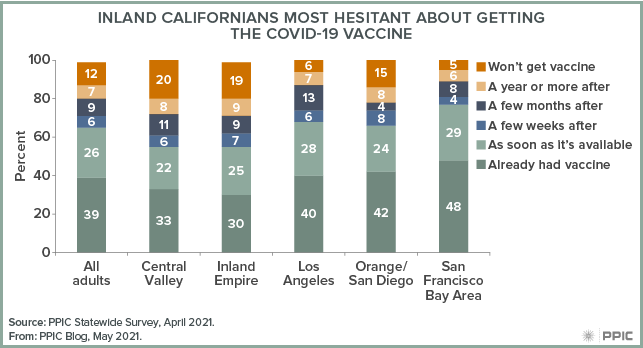
Vaccine hesitancy is far from uniform around the state. Residents in the Central Valley (8% wait at least a year, 20% will not get vaccine), the Inland Empire (9%, 19%), and Orange/San Diego (15%, 8%) are more likely than those in Los Angeles (7%, 6%), and the San Francisco Bay Area (6%, 5%) to express hesitancy.
Beyond variation across regions and demographic groups, there are also noteworthy differences across political parties. Republicans (10% wait at least a year, 22% will not get vaccine) and independents (7%, 17%) are far more likely than Democrats (4%, 3%) to be hesitant.
As the state and nation work toward herd immunity, willingness to get the vaccine will be a crucial factor in putting the pandemic in our rearview mirror. Stay tuned to the PPIC Statewide Survey as we continue to track attitudes toward COVID-19 and the vaccine.