More than eight in ten eligible Californians are registered to vote—one of the highest registration rates on record for a primary election year.
- As of May 2022, 21.9 million of California’s 26.9 million eligible adults (82%) were registered to vote.
- The current registration rate is 6 percentage points higher than it was in May 2018 (76%), six months prior to the last gubernatorial and midterm elections.
- Voter registration and enthusiasm will play a big role in the election for governor, as well as in California’s competitive races for the US House of Representatives.
Likely voters lean Democratic and are ideologically mixed.
- Among likely voters in our surveys over the past year, 47% are Democrats, 26% are Republicans, 22% are independents, and 5% are registered with other parties. Of those we consider infrequent voters, 44% are Democrats, 33% are independents, 19% are Republicans, and 4% are registered with other parties.
- Ideologically, 39% of likely voters are politically liberal, 31% are moderate, and 31% are conservative. Among infrequent voters, 28% say they are liberal, 42% are moderate, and 30% are conservative.
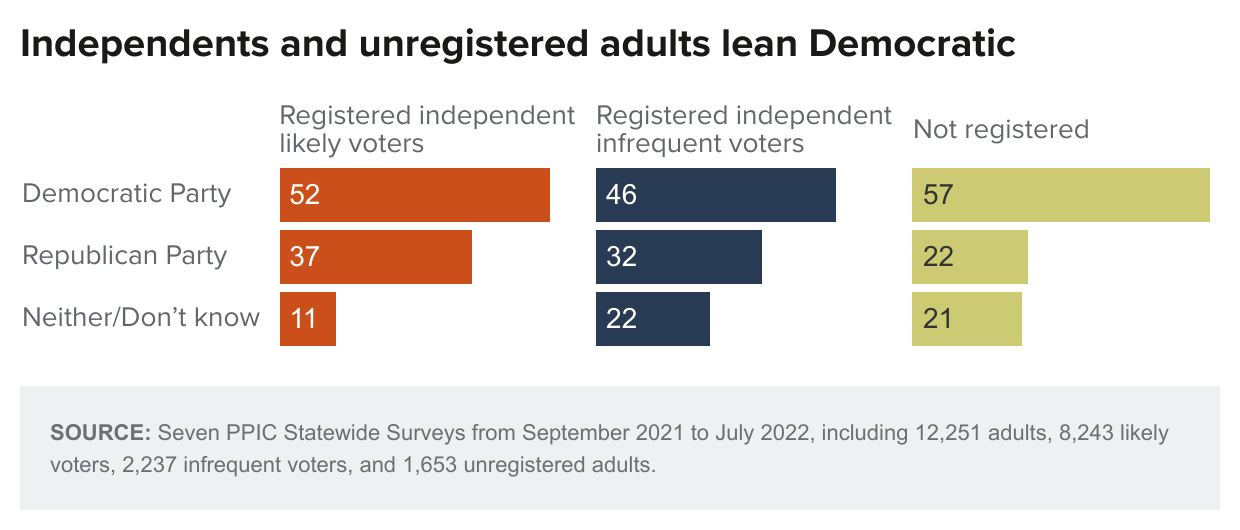
Independent likely voters and unregistered adults lean Democratic.
- Among independent likely voters, 52% lean toward the Democratic Party, while 37% lean toward the Republican Party and 11% volunteer that they lean toward neither major party or are unsure.
- Among independent infrequent voters, 46% lean Democratic, 32% lean Republican, and 22% lean toward neither party or are unsure.
- Among unregistered adults—including noncitizens—57% lean Democratic, 22% lean Republican, and 21% lean toward neither party or are unsure.
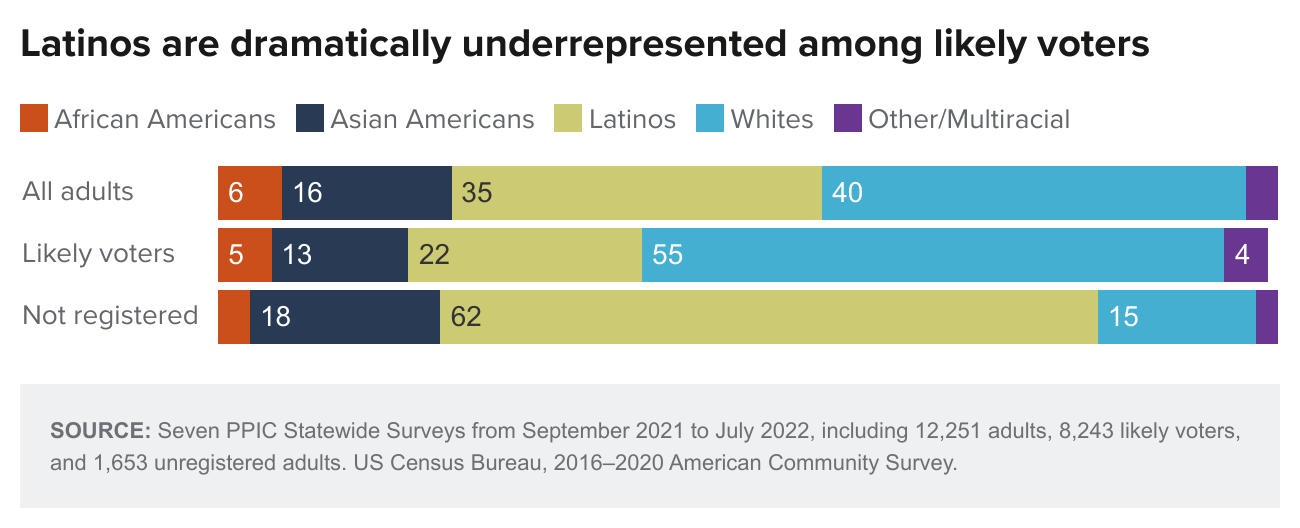
Likely voters are disproportionately white.
- Whites make up only 40% of California’s adult population but 55% of the state’s likely voters. In contrast, Latinos comprise 35% of the adult population but just 22% of likely voters. Asian Americans make up 16% of adults and 13% of likely voters, while 6% of adults and 5% of likely voters are African American. “Other race” and multiracial adults make up 3% of the adult population and 4% of likely voters.
- About six in ten unregistered adults, including noncitizens, are Latino (62%); fewer are Asian American (18%), white (15%), or African American (3%).
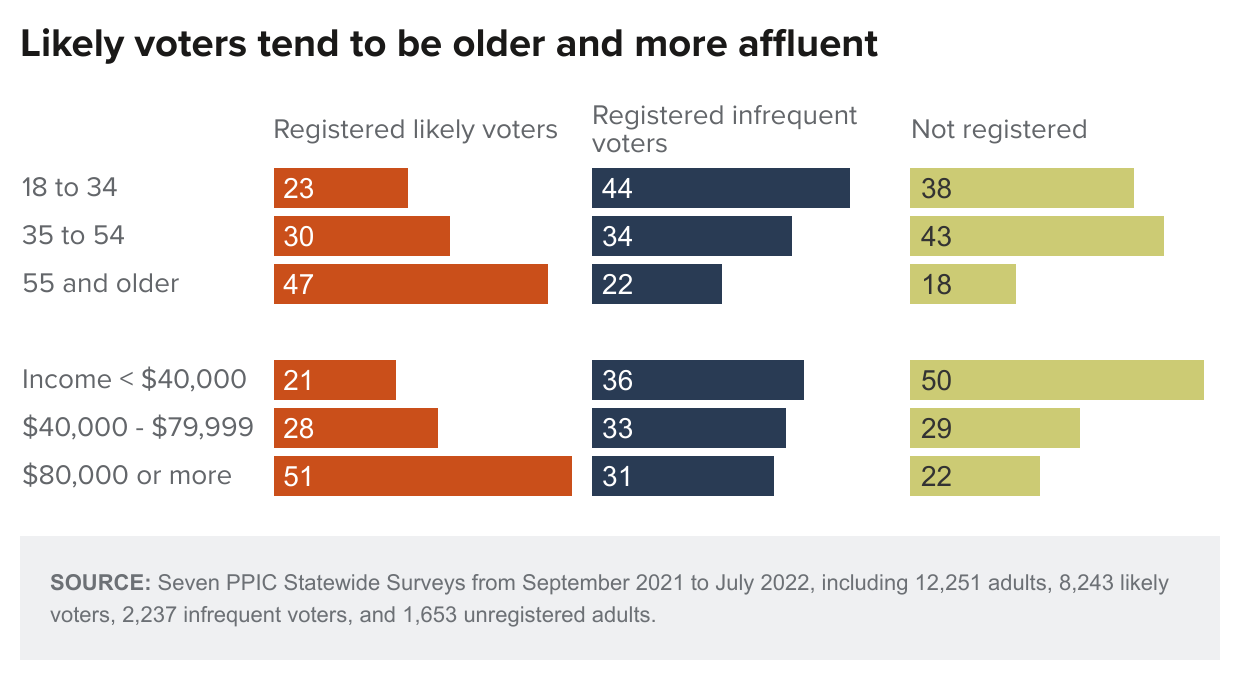
Likely voters tend to be older, more educated and affluent, homeowners, and US born.
- Californians age 55 and older make up 34% of the state’s adult population but constitute 47% of likely voters. Young adults (age 18 to 34) make up 32% of the population but only 23% of likely voters, while adults age 35 to 54 account for 34% of the population and 30% of likely voters.
- Eight in ten likely voters either have some college education (40%) or are college graduates (41%); 19% have no college education.
- Fifty-one percent of likely voters have annual household incomes of $80,000 or more, while 28% earn between $40,000 and $79,999 and 21% earn $40,000 or less.
- A strong majority of likely voters are homeowners (67%), while 33% are renters. In contrast, 71% of unregistered adults and 61% of infrequent voters are renters.
- Eighty-two percent of likely voters were born in the United States.
- Women (51%) and men (49%) make up similar shares of California’s likely voters.