- The cost of water is rising.
Utilities rely on revenue from ratepayers to support water system costs, and water bills vary across the state. Water systems that rely on groundwater tend to have lower rates, because treatment and delivery costs are relatively low. Economies of scale are also important determinants of cost and affordability, with smaller systems facing higher per-customer costs for system investments. To cover rising costs, water bills have been rising faster than inflation in many parts of California. Investments to replace aging infrastructure, meet new treatment standards, diversify supplies, and maintain a well-trained workforce will continue to raise costs. Sewer systems are seeing somewhat similar trends.
Average water bills vary considerably across urban water systems
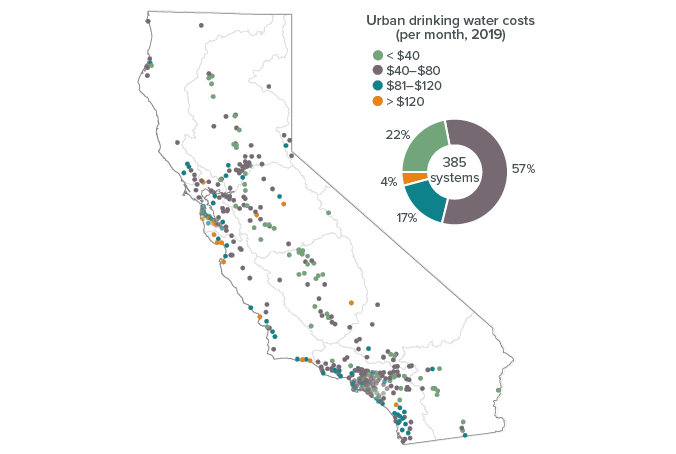
SOURCE: Author calculations using the State Water Board’s Electronic Annual Reporting data (2019).
NOTES: This figure shows the monthly drinking water costs for 385 urban water suppliers, which serve roughly 92% of all Californians. Costs reflect the typical drinking water bill for utility customers consuming 12 HCF (hundred cubic feet) per month (748 gallons = 1 HCF). Estimates of affordability reported in the text for basic water needs are based on charges for 6 HCF per month.
- There is no single guideline for determining whether water bills are too high.
Affordability is important for both communities and households: Do communities have the resources to maintain safe water systems, and can low-income households afford their water bills? One measure of community-level affordability is the cost of water as a share of median household income. Using a threshold of 1.5%, the State Water Board recently estimated that 21% of the state’s water systems, serving 18% of all residents, have water rates that are unaffordable for basic needs like cooking, washing, and drinking. Even more individual households may face difficult trade-offs between paying for water and meeting other basic needs. The state identified 34% of all households earning less than 200% of the federal poverty level as potentially in need of rate assistance. More precise local measures of affordability—for instance, including housing costs in calculations—could better inform affordability programs. - Public water agencies are restricted in assisting low-income customers with water bills.
Many large utilities offer “lifeline” rates that can subsidize bills of low-income customers, but enrollment is often low. Private water utilities have been able to expand these programs as rates have risen. In contrast, public agencies have been constrained since the 1996 passage of Proposition 218—a constitutional amendment that requires a tight connection between water rates and cost of service. To launch or expand assistance programs, these agencies need to use non-rate revenue (e.g., property taxes) or seek approval of new taxes by two-thirds of local voters. As an alternative, the State Water Board has recommended a statewide low-income water rate assistance program to benefit about 4.7 million households at a cost of about $600 million annually. Congressional bills have proposed federal water rate assistance, similar to an energy rate assistance program. Racial income disparities mean people of color are more likely to need assistance. - Rate design can help keep prices low for basic needs.
The amount of water required for basic needs—roughly 50 gallons per person per day— is low relative to the average customer’s water use. Most bills contain two parts: a fixed monthly service charge, and a volumetric portion that rises with the amount of water used. Since most water system costs do not vary with the amount of water sold, utilities have some incentives to set a high fixed service charge to maintain financial stability. But this strategy has affordability tradeoffs because it increases the costs of water for meeting basic needs. Water agencies can also support affordability by making concerted efforts to contain water system costs.
Local agencies are spending more to operate and maintain their systems
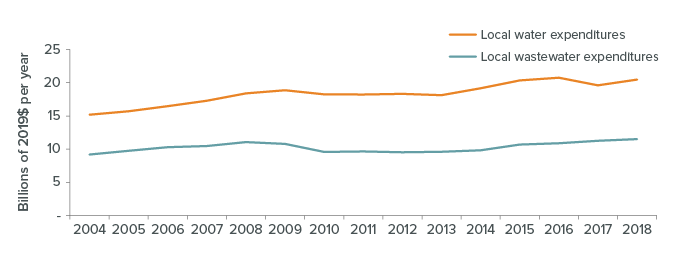
SOURCE: Author estimates using data from the California State Controller’s Office.
NOTES: This figure shows operating and capital expenditures for local public drinking water and wastewater agencies (cities, counties, and special districts) adjusted for inflation (using the 2019 CPI index). Adjusting for population growth (using population numbers from the Department of Finance), real expenditures also increased, but at a slower pace: by $200 million per year for water and $500,000 per year for wastewater.
- Avoiding shutoffs protects public health, but at a cost to local water systems.
While it is often the last resort, service disconnection can result from nonpayment of bills. Utilities work with customers on repayment plans and provide support for those at risk, but shutoffs are a way to enforce payment and recoup necessary revenue. At the beginning of the COVID-19 pandemic, a statewide moratorium on water shutoffs maintained access for vulnerable residents. But it also reduced revenues and added to a ballooning water debt problem: by early 2021, at least 155,000 households owed more than $1,000 in water bills. The federal stimulus and the state budget propose funding to alleviate arrears. Better data on which customers are unable to pay can help tailor solutions, such as avoiding shutoffs during emergencies, reducing fees on water debt, and providing a minimum amount of water to those who cannot afford to pay.