
Table of Contents
- Key Takeaways
- Introduction
- Current TK Program and Expansion Plans
- What Does Statewide TK Participation Look Like?
- Is TK Participation Equitable Across Districts?
- Is TK Participation Equitable Across Schools?
- Conclusions and Recommendations
- Notes and References
- Authors and Acknowledgments
- PPIC Board of Directors
- Copyright
Key Takeaways
California is on the cusp of implementing universal preschool—a step that could help level the playing field for young children. Over the next few years, all four-year-olds will become eligible for Transitional Kindergarten (TK), which has been part of the state’s early learning programs since 2012. To help prepare for an equitable expansion, we provide a demographic portrait of TK students and the districts and schools offering TK, highlighting existing gaps in participation and access.
- As of 2019, TK served about 90,000 students statewide. Roughly 41,000 eligible children were not enrolled. Lack of enrollment could be due to many factors, including a lack of TK at the district or school, insufficient slots at a given school, and low levels of family interest or awareness.
- Expanding TK to all schools serving kindergarteners and improving outreach to parents will be critical to improve access. We estimate 61 percent of unserved students (about 25,000) reside in districts offering TK but in school zones that do not. Meanwhile, 8 percent (3,300 unserved children) live in districts that do not provide TK at all, even though TK provision is mandatory. An additional 31 percent (13,000 unserved children) live in school zones where TK is already provided.
- Educators and policymakers should monitor disparities in participation. Encouragingly, participation among Dual Language Learners and Latino students is relatively high, and students from low-income families participate at rates similar to students overall. However, Native American and Pacific Islander students appear consistently underrepresented, both due to a lack of TK in their districts and schools, and lower enrollment when it is offered. When TK is provided, participation is also lower for Black students.
- While some districts are well positioned to move toward universal TK, others may need more support or incentives. Compared to other districts, rural districts are less likely to offer TK at 80 percent or more of their schools; the same is true for basic-aid districts, which are funded primarily through property taxes rather than the state funding formula. Providing support to address transportation and staffing challenges may help improve participation in rural districts. The state should also consider accountability measures to encourage all districts to provide TK, as they are required to do.
Introduction
As the state prepares to implement universal preschool, one of the central concerns is whether the expansion will serve the needs of Dual Language Learners (DLLs), students from low-income families, and students of color. Kindergarten students in California have some of the largest gaps in school readiness in the country—and greater access to high-quality early learning is a proven way to reduce these disparities (Stipek 2019). In the 2019–20 school year, only 37 percent of California four-year-olds were enrolled in preschool, Transitional Kindergarten, or another public early childhood program (NIEER 2021). Children from low-income families in particular benefit from access to universal preschool (Cascio 2019).
Beyond narrowing gaps in school readiness, early childhood education can yield numerous long-term benefits. While some research studies show that the early gains (e.g., higher standardized test scores) appear to dissipate in later elementary or middle school years, other academic and non-academic measures improve later on. For example, Gormley, Phillips, and Anderson (2017) find that middle school students who participated in district preschool took more honors courses and were less likely to repeat a grade than their peers who did not attend district preschool. Other research shows increased rates of high school graduation and college enrollment, higher earnings, reduced rates of welfare use, and lower rates of contact with the criminal justice system for preschool graduates (Gray-Lobe et al. 2021; Currie 2001; Duncan and Magnuson 2013). Impressively, one recent study finds that even the children of preschool graduates experience improved educational and employment outcomes, relative to the children of non-preschool graduates (Garcia, Heckman, and Ronda 2021).
In the 2025–26 school year, all four-year-olds in California will be eligible to attend a Transitional Kindergarten (TK) program at their district schools. TK has been a part of the state’s K–12 system since 2012–13, providing an early start to kindergarten with credentialed teachers and an age-appropriate curriculum. But currently only older four-year-olds are eligible to participate.
Research on California’s implementation of TK is somewhat limited. However, an early study showed that there were immediate gains for students who had enrolled in TK, including for English Learners (Manship et al. 2017). This finding is echoed in a study examining the impact of TK at San Francisco Unified School District (Doss 2019). As the program further expands, additional research on the short- and long-term benefits for TK graduates in California will be essential. Maintaining program quality will also be critical, as quality is not always equitable for universal preschool programs (Fuller et al. 2020).
Between now and when universal TK is fully implemented, there are a number of expansion-related challenges on the horizon, including finding TK teachers and aides for new classrooms, reducing student-teacher ratios, modifying existing facilities, and encouraging families to participate. Schools are also still in the throes of adapting and readapting to COVID-19 safety protocols, making up for students’ lost learning time, and planning to expand access to before- and after-school care. Further, other early childhood and preschool programs may also be affected by the transition as families consider their expanded options—and as the state considers how to reallocate state and federal funds for subsidized care.
One key issue as the state moves toward universal TK is whether programs are serving students equitably—and how to ensure equity going forward. The research shows that high-quality early education can have long-lasting benefits for underrepresented students, but are these students getting the opportunity to enroll in TK? In this report, we examine the demographic characteristics of current students and the characteristics of the districts and schools offering TK in order to understand whether TK is currently being provided in an equitable manner. Specifically, we ask if DLLs, students from families eligible for free and reduced-price meals (FRPM eligible, a proxy for low income), and students of color participate in TK in the numbers we expect given their age eligibility. We then provide recommendations for the state as it moves forward with expanding TK to help the program achieve true universal access and meet the goal of narrowing gaps in school readiness.
Current TK Program and Expansion Plans
Enrollment in TK is driven by a number of factors, including whether a program is offered nearby, whether families of eligible children prefer TK to other options, and whether parents even know about the program. Currently, all school districts serving kindergarteners are required to offer TK, but there is no requirement that each elementary school does so. This means that families of eligible four-year-olds may find that the TK location in their district is not convenient. And TK, like kindergarten, is optional, so families may choose not to enroll eligible children even if slots are available. The wide range of other options include public preschool (such as the California State Preschool Program or Head Start), private preschool, child care, or remaining at home. The number of hours of care provided is one critical factor for families selecting a preschool program. Starting in 2022–23, all school districts with high concentrations of English Learners and students from low-income families must offer nine hours of care daily through the Expanded Learning Opportunities Program, including for children enrolled in part-day programs (Fensterwald 2021). Prior to the 2022–23 school year, families wanting a full day of child care may have opted out of TK because even full-day TK does not provide care for a full day of work for parents.
The 2021–22 California state budget committed to fund universal access for four-year-old children to TK by 2025–26, estimated at $2.7 billion for full implementation. This includes $300 million to support district planning, teacher training, and expanding the teacher workforce (in order to provide more classrooms and reduce class sizes), as well as $490 million for constructing and modernizing facilities. The expectation in the state’s expansion plan is that eventually all four-year-olds will be eligible for and have access to a TK program as a part of the K–12 system. While students of all income levels can attend TK, funding for expansion planning in the 2021–22 school year prioritizes districts with more DLL/EL students and students from low-income families.
The 2021–22 school year is a planning year and the rules for TK eligibility remain the same. The official expansion schedule adds two months of eligible birthdates each year between 2022–23 and 2024–25, and in 2025–26, all children who turn four by September 1 will be eligible. As newly eligible students are added to TK classrooms, the Local Control Funding Formula will fund school districts for the additional children attending the program.
What Does Statewide TK Participation Look Like?
In this section, we examine enrollment in TK and investigate how successfully the current TK program is reaching eligible students—especially DLLs, students from low-income families, and students of color—throughout the state.
In 2019, TK served approximately 90,000 students, a number that has grown over time (Figure 1). In the early years of California’s program, fewer children were eligible, though birthdate eligibility has remained the same since 2014.
Transitional Kindergarten has served an increasing number of four-year-olds over time
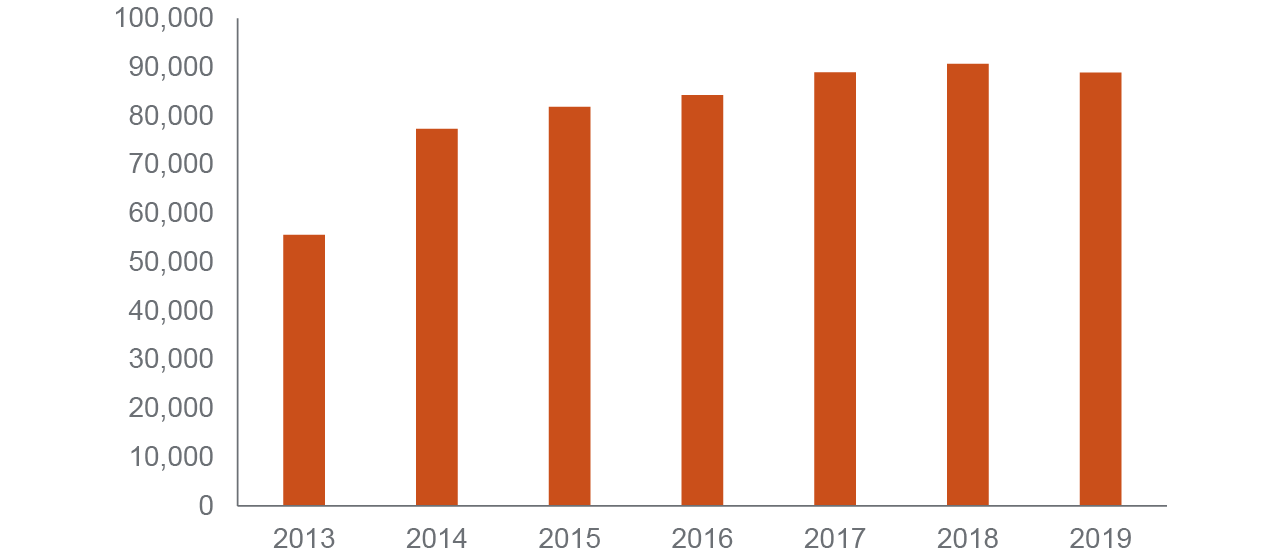
SOURCE: California Department of Education (CDE) TK enrollment.
NOTES: TK Census day counts. TK data for 2012–13 is not publicly available.
Nearly 30 percent of TK students are DLLs and nearly 60 percent are from low-income families, somewhat higher than their representation among the K–12 population overall. Current TK students are approximately representative of the racial/ethnic distribution of students in the state (Figure 2). Nearly 60 percent are Latino, 22 percent are white, 8 percent are Asian, 5 percent are Black, 5 percent are multiracial, and 2 percent are Filipino. Native American and Pacific Islander students represent less than 1 percent of the total TK enrollment in the state.
Current TK students are roughly representative of the racial diversity of California’s K–12 students
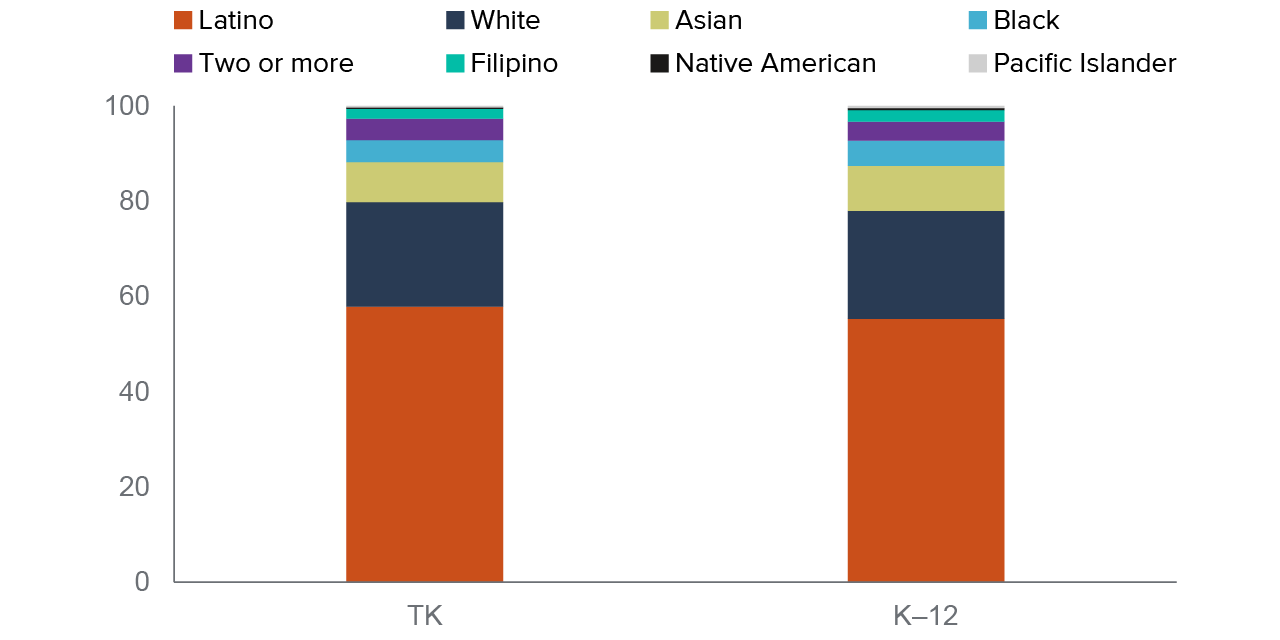
SOURCE: CDE TK enrollment, 2019–20.
NOTES: TK Census day counts. CDE breaks out Filipino students from other Asian students and we follow that practice in this report.
Does Participation Vary across Student Groups?
We estimate about 80 percent of eligible students, or roughly 21 percent of all four-year-olds, are enrolled in TK in California. At the state level, it is clear that expanding birthdate eligibility is associated with increased participation—but participation has also increased over time, under the same eligibility rules. For example, we see a large increase in participation from 2014 to 2015, when more children became eligible (Figure 3). In 2015, 25 percent of students were eligible, but only 15 percent participated. However, by 2019, that number had climbed to 21 percent, even as the proportion of eligible students remained the same.
Encouragingly, we see that participation among DLLs and students from low-income families is higher than or similar to overall participation levels. Notably, take-up rates have always been somewhat higher among DLL students than students overall (22% among DLLs in 2019). Meanwhile, students from low-income families are participating in TK at a rate similar to all students (21% in 2019), and have been since the program’s inception.
Dual Language Learners participate in TK at higher rates than students overall
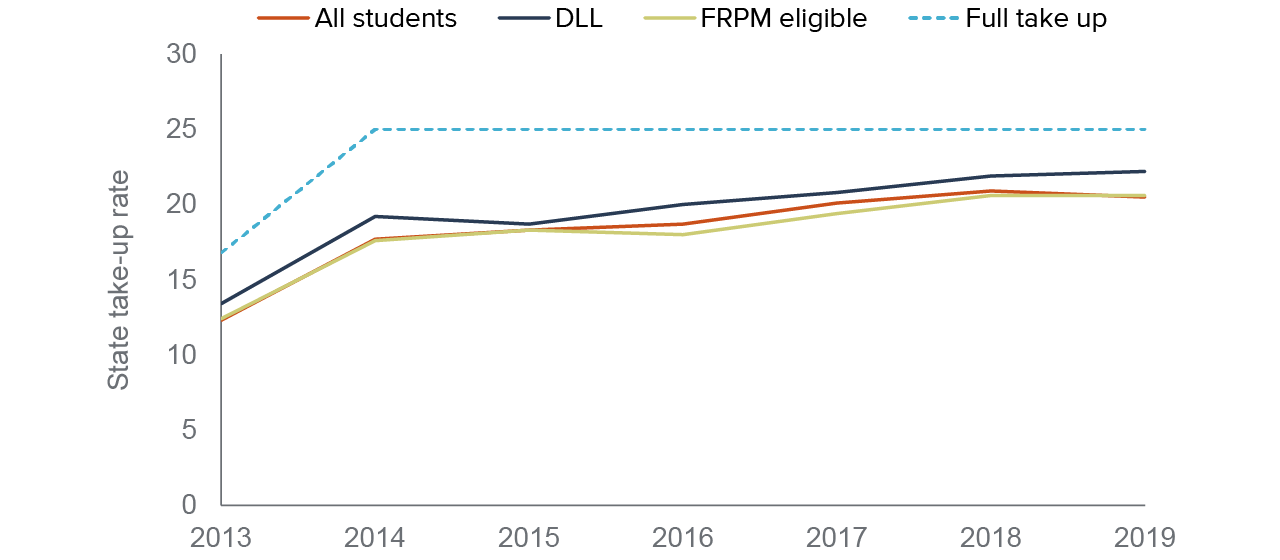
SOURCE: CDE TK enrollment.
NOTES: TK Census day counts. “FRPM eligible” refers to eligibility for free and reduced-price meals, a proxy for low income. If all eligible students participated, full take up would be 16.7 percent in 2013–14 and 25 percent for each year 2014–15 and later; the full take-up rate is indicated by the dashed line. If we exclude Los Angeles Unified, the DLL take-up rate is 19.7 percent and the take-up rate for all students is 18.7 percent; the take-up rate for FRPM-eligible students falls slightly below the rate for all students, to 18 percent. These results can be seen in Technical Appendix Figure B3.
Despite relatively high take-up rates among DLL students overall, there are important differences in participation by racial/ethnic groups (Figure 4). In 2019, Pacific Islander students who are Dual Language Learners had take-up rates substantially below those of other groups (14% vs. over 20% for Black, Latino, Asian, and white DLL students, Figure 4). Pacific Islander students (14%) and Native American students (16%) from low-income families also had lower take-up rates than other racial/ethnic groups, especially compared to low-income, Latino students (21%).
Pacific Islander students who are DLL or from low-income families are underenrolled in TK
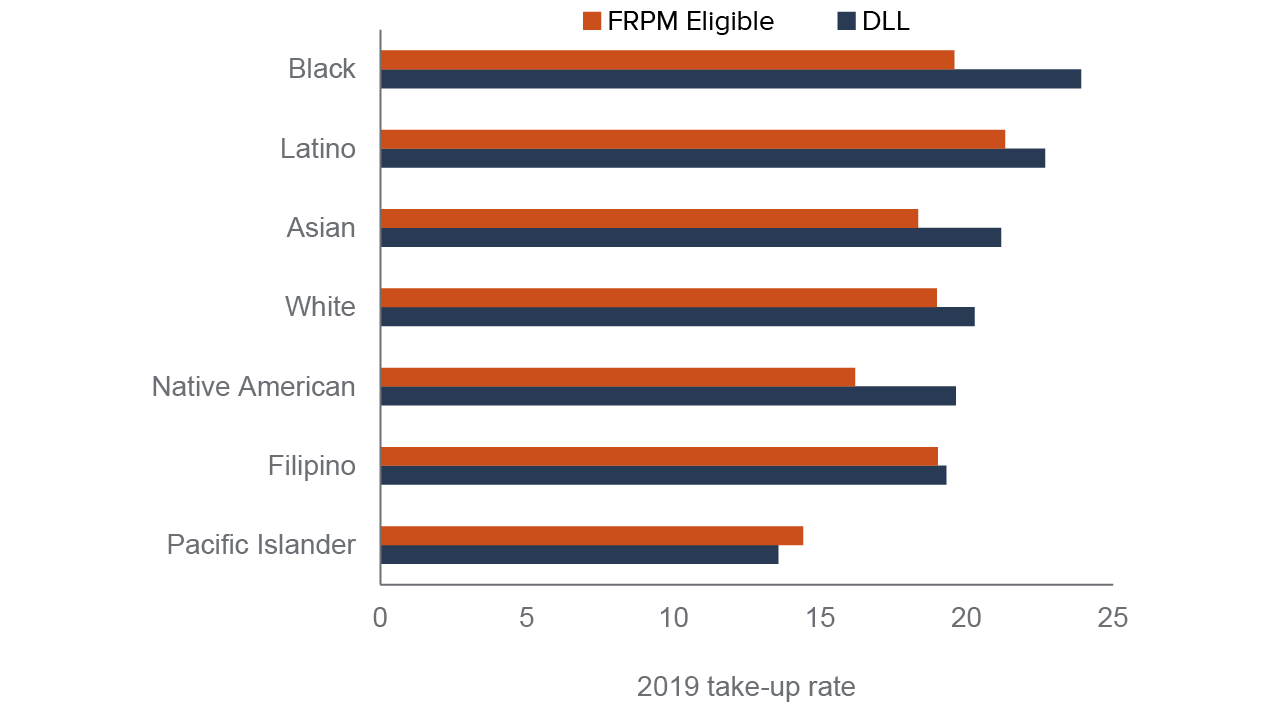
SOURCE: 2019–20 school year, CDE TK enrollment.
NOTES: TK Census day counts. “FRPM eligible” refers to eligibility for free and reduced-price meals, a proxy for low income. Full take-up rate would be 25 percent. See Technical Appendix Figure B4 for take-up rates when Los Angeles Unified is excluded.
For most racial/ethnic groups, DLL students have higher participation than non-DLL students—the exceptions being Filipino and Pacific Islander DLL students, who have lower take-up rates. Across racial/ethnic groups, students from low-income families tend to have lower take-up rates than students from higher-income families, with the exception of Asian and Black students from low-income families, who have similar or slightly higher take-up rates compared to those from higher-income families. Technical Appendix Figure B5 compares take-up rates for DLLs and non-DLLs, and Figure B6 shows take-up rates for students from low-income families and students from higher-income families.
Statewide, it appears that not all eligible students are being served by TK, but DLL students participate at somewhat higher rates. Understanding current inequities in TK take-up rates will allow districts to make decisions about which schools should offer TK in order to increase access for families that are currently underserved.
Is TK Participation Equitable Across Districts?
In this section, we examine TK provision and participation across districts, including whether district characteristics are associated with take-up rates across student groups. We focus on districts with high shares of Black or Latino students, low-income students, or English Learners; as well as rural districts and “basic aid” districts, which are primarily funded through property taxes rather than the state funding formula.
There is wide variation in TK participation across districts. For example, when we look at the 10 largest districts in the state, the take-up rate ranges from 10 percent at San Francisco Unified to 36 percent at Los Angeles Unified (Figure 5). Los Angeles Unified provides both TK and Expanded TK programs, serving many more children than are strictly eligible. San Diego Unified, with a 23 percent take-up rate, also serves a greater proportion of four-year-olds than the average district in the state, and the district announced in 2021 that it intends to expand TK to all four-year-olds in the 2021–22 school year, well in advance of the full expansion date set by the state (Taketa 2021). Others districts (e.g., San Francisco Unified) have robust preschool and child care options outside the K–12 system, and this may lower the proportion of eligible children who participate in TK.
Participation in TK ranges widely across California’s 10 largest districts
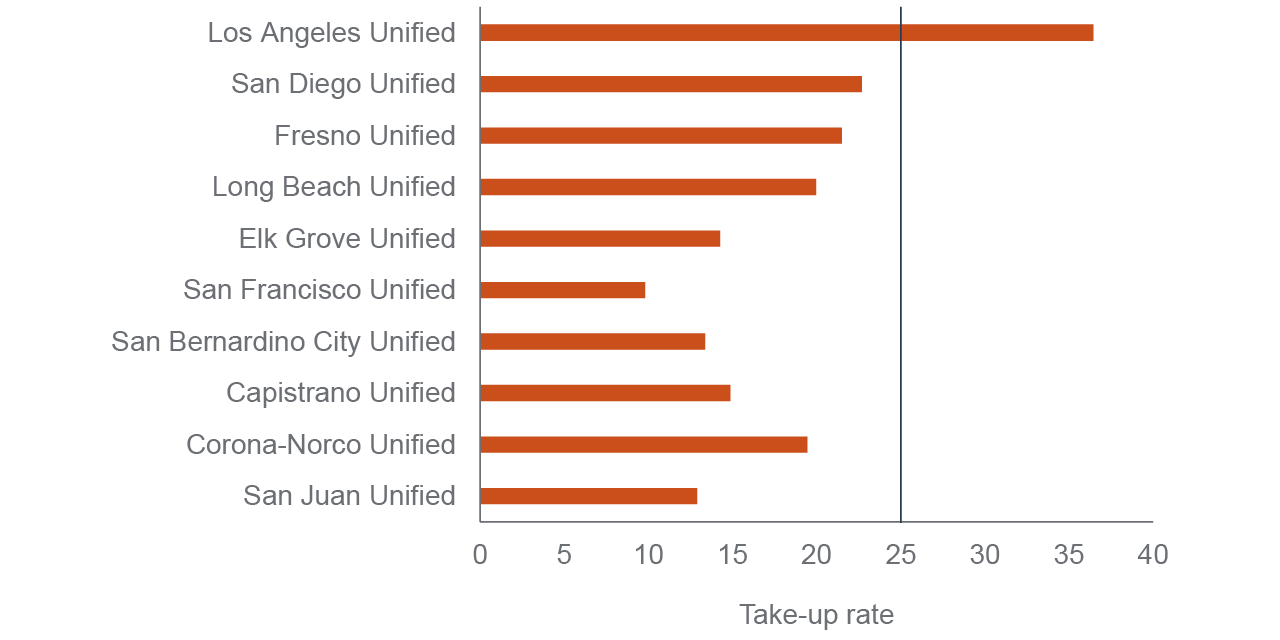
SOURCE: CDE TK enrollment, 2019–20.
NOTES: TK Census day counts. Districts ordered by enrollment, from largest at the top to smallest at the bottom. The blue vertical line represents the full take-up rate of 25 percent. Data for San Francisco Unified is from the 2018–19 school year.
Does Provision and Participation Vary by District Type?
Among districts with kindergarten students, we find 17 percent of districts do not offer TK at all. One key dimension related to whether districts provide TK is whether they are funded through the Local Control Funding Formula (LCFF) or not. The latter are referred to as “basic aid” districts. These districts do not receive supplemental funding from the state because revenues from their local property taxes are sufficiently high to fund their schools. While all districts serving kindergartners are required to provide TK, the mechanism for ensuring they do so is the funding formula. Since basic-aid districts do not receive funding through the LCFF, the California Department of Education has little leverage to ensure they offer TK (D’Souza 2021). However, like all districts, basic-aid districts are required to offer TK.
The result is a substantial, 23 point gap between basic-aid and LCFF districts in the provision of any TK program (Figure 6). It is worth noting that despite this disparity basic-aid districts make up only 28 percent of all districts not providing TK (and comprise about 15 percent of districts in California). Notably, our analysis suggests that both basic-aid and LCFF-funded districts that do offer TK have a higher proportion of DLL students, as well as higher proportions of Latino and Asian students, but lower proportions of Pacific Islander and Native American students, than the districts that do not offer TK (Technical Appendix Table B1).
Districts funded through the LCFF are more likely to provide TK
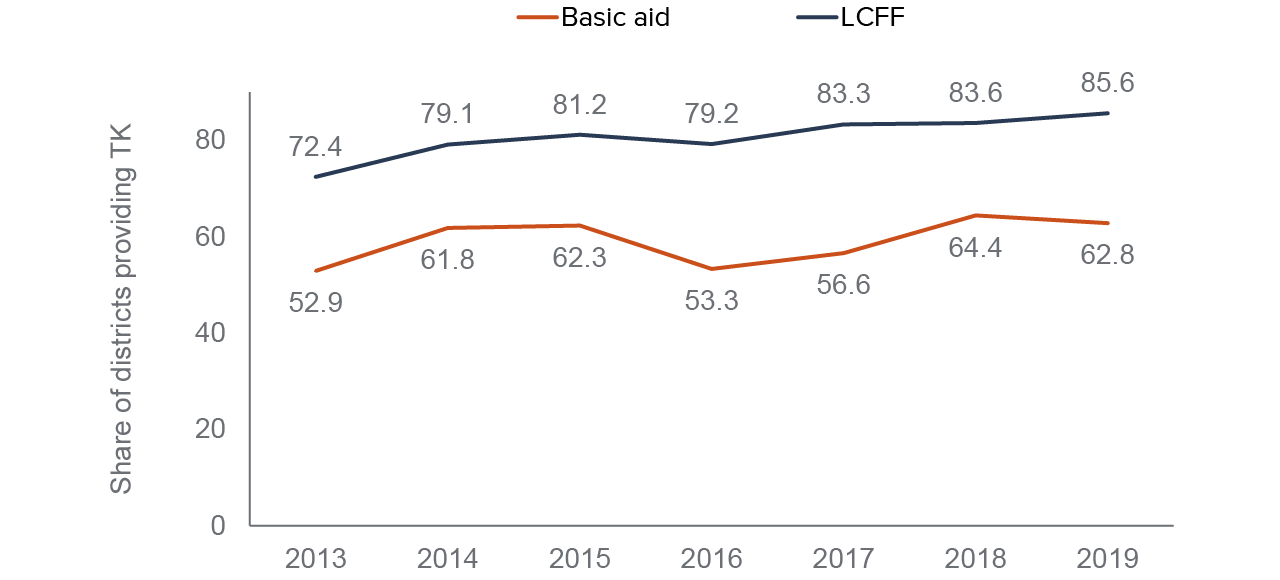
SOURCE: CDE enrollment and district characteristics data.
NOTE: TK Census day counts, all elementary and unified school districts.
As California gears up to expand TK to serve all four-year-olds, the grant funding available beginning in the planning year 2021–22 places at least some funding priority on districts with higher shares of high-need students. We have already established that, statewide, TK serves low-income students in similar proportions to those served in kindergarten classes, while serving DLL students at a slightly higher rate than in kindergarten classes.
At the district level, we similarly find no evidence that the district’s percentage of students who are English Learners, from low-income families, or both is associated with TK take-up rates (Figure 7). The correlation between a district’s take-up rate and its share of English Learners and students from low-income families is effectively zero, as shown in the horizontal line in Figure 7, suggesting that students in districts with high proportions of ELs and students from low-income families have at least as much access as those from districts with lower proportions of these students. The size of the bubble indicates the size of the school district, with Los Angeles Unified represented by the largest bubble.
There is no relationship between a district’s TK participation and its share of ELs and students from low-income families
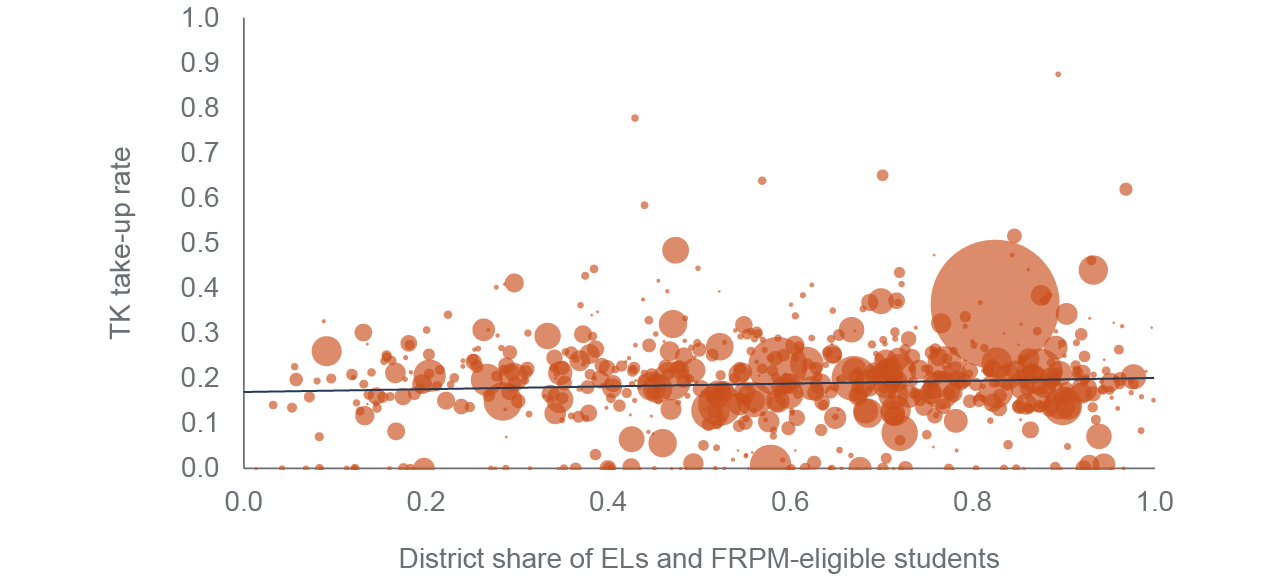
SOURCE: CDE enrollment and district characteristics data, 2019–20.
NOTES: TK Census day counts, all elementary and unified school districts. “FRPM eligible” refers to eligibility for free and reduced-price meals, a proxy for low income. The size of district enrollment is represented by the size of the bubbles. Regression is not weighted by district size. Districts with fewer than 250 students are excluded. A small percentage of districts not providing TK are charters (6%), and they are found among both LCFF and basic-aid districts. The circles on the zero line of the horizontal axis indicate that some districts (17%) do not provide TK at all. The R2 is 0.007.
Next, we classify districts by their demographics to understand if those characteristics appear to influence participation in TK. Because Los Angeles Unified has such a large take-up rate and serves a disproportionate share of the state’s TK students, we exclude the district from the analysis here. We examine five district types that are important to understanding whether TK slots appear equitably distributed:
- High Black/Latino: 75 percent or more of the students are Black or Latino
- High poverty: 75 percent or more of the students are eligible for free or reduced-price meals
- High EL: 25 percent or more of the students are English Learners/Dual Language Learners
- Rural: located in a rural area, as defined by the National Center for Education Statistics
When we examine take-up rates for students overall (Figure 8), we do not see much variation across district types. High-poverty districts have the highest take-up rate (20.1%), but this is not dramatically higher than that of high-EL districts, which have the lowest take-up rate (18.3%).
TK participation is somewhat higher in high-poverty districts
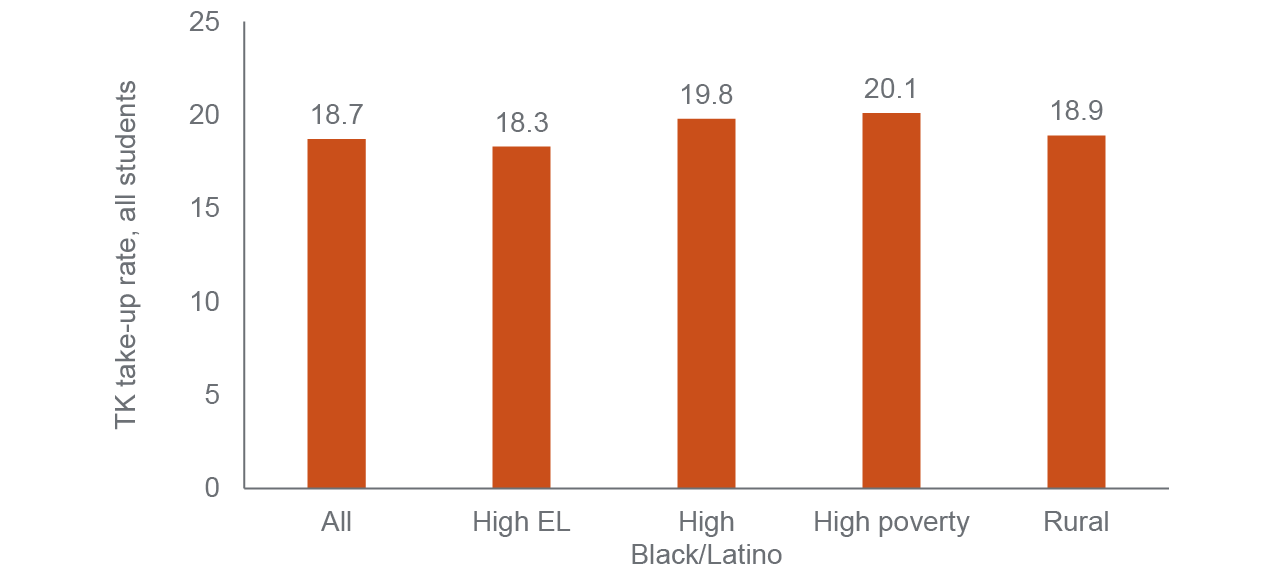
SOURCE: CDE enrollment and district characteristics data, 2019–20.
NOTES: TK Census day counts. All elementary and unified school districts, excluding Los Angeles Unified.
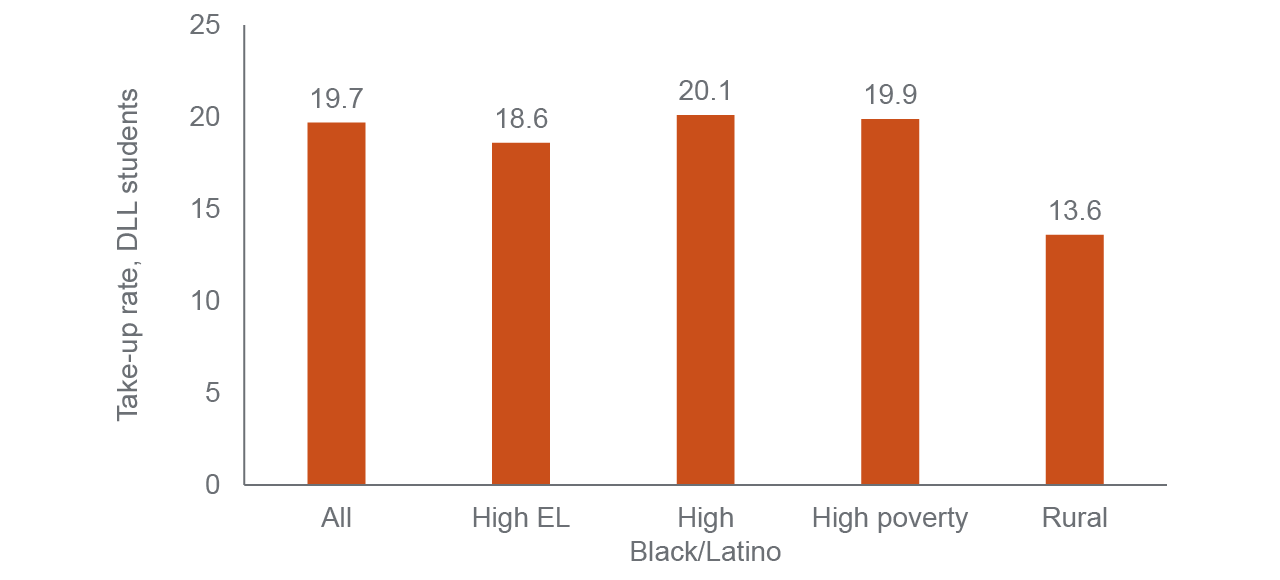
When we examine take-up rates for Dual Language Learners and students from low-income families, we see that there are notable differences, especially in rural districts. DLL take-up rates are only 13.6 percent in rural districts, compared to 19.7 percent overall (Figure 9). These low rates in rural districts appear to be driven by small districts. When we exclude districts with fewer than 250 students, DLL take-up rates in rural districts nearly double to 27 percent (Technical Appendix Figure B8). Students from low-income families are also somewhat less likely to participate in TK in rural districts (16.5% vs. 18% overall) (Technical Appendix Figure B9).
Dual Language Learners have lower TK participation in rural districts
SOURCE: CDE enrollment and district characteristics data, 2019–20.
NOTES: TK Census day counts. All elementary and unified school districts, excluding Los Angeles Unified.
Is TK Participation Equitable Across Schools?
Districts have choices about where to offer TK slots. While all districts serving kindergartners are required to offer TK, they can choose which elementary schools provide it. Here we explore the extent to which schools serving kindergarteners also provide TK, and how that varies by district and school characteristics. We then discuss the extent to which variation in these choices may contribute to equity in TK access among eligible children. Overall, we estimate that 78 percent of schools offering kindergarten also offer TK (excluding single-school districts, which are included in the analysis above).
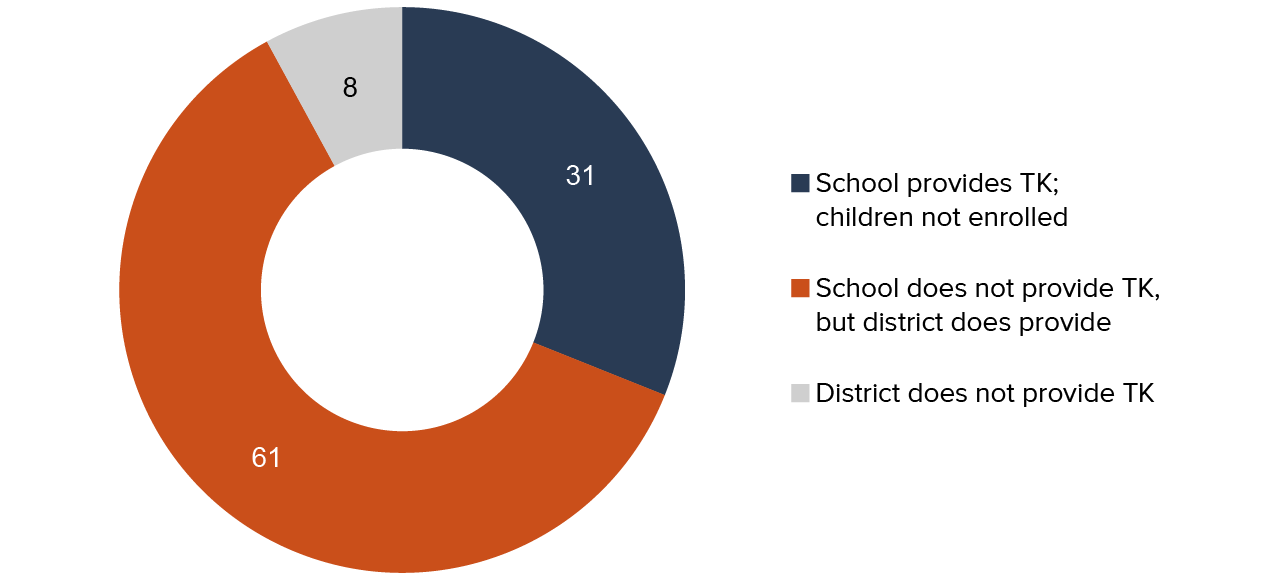
First, we characterize the children potentially eligible for TK, but not enrolled, by a rough measure of access: whether TK is provided at their neighborhood school. In total, we estimate in 2019 that there were over 41,000 students eligible for TK, but not enrolled, given the currently qualifying birthdates. The most common situation for unenrolled eligible students is that they attend a school that does not offer TK, even though their district does—61 percent (or about 25,000 students) fall into this category (Figure 10). The next most common situation is that their school offers TK, but they are not enrolled (31%, 13,000 students). Residing in a district that does not offer TK accounts for only 8 percent of unenrolled eligible children (3,300 students). When a district offers TK, we do not know why potentially eligible children are not enrolled—it could be because of a lack of spots, a lack of interest among families, parents’ choice of another type of preschool, or other reasons.
Most eligible, unenrolled children attend a school that does not offer TK, even though their district offers TK
SOURCE: CDE TK enrollment, 2019–20.
NOTES: TK Census Day counts. All schools serving kindergarten students, including charters, are included. We estimate eligible children at the school level. If a school serving kindergarteners is serving fewer than 25 percent of the size of their kindergarten class in TK, we count that difference as eligible TK students. Because some districts provide Extended TK or other TK programs that allow younger birthdates to qualify for TK participation, our estimates may undercount students not enrolled in schools providing TK.
Eligible DLLs and students from low-income families who are not enrolled are slightly more likely to be in schools that provide TK, compared to the average student (Technical Appendix Table B1). While families should choose the option that best suits their needs and preferences, this disparity suggests that targeted outreach to ensure all families are informed of the available TK options could be important.
How Often Is TK Offered at Schools?
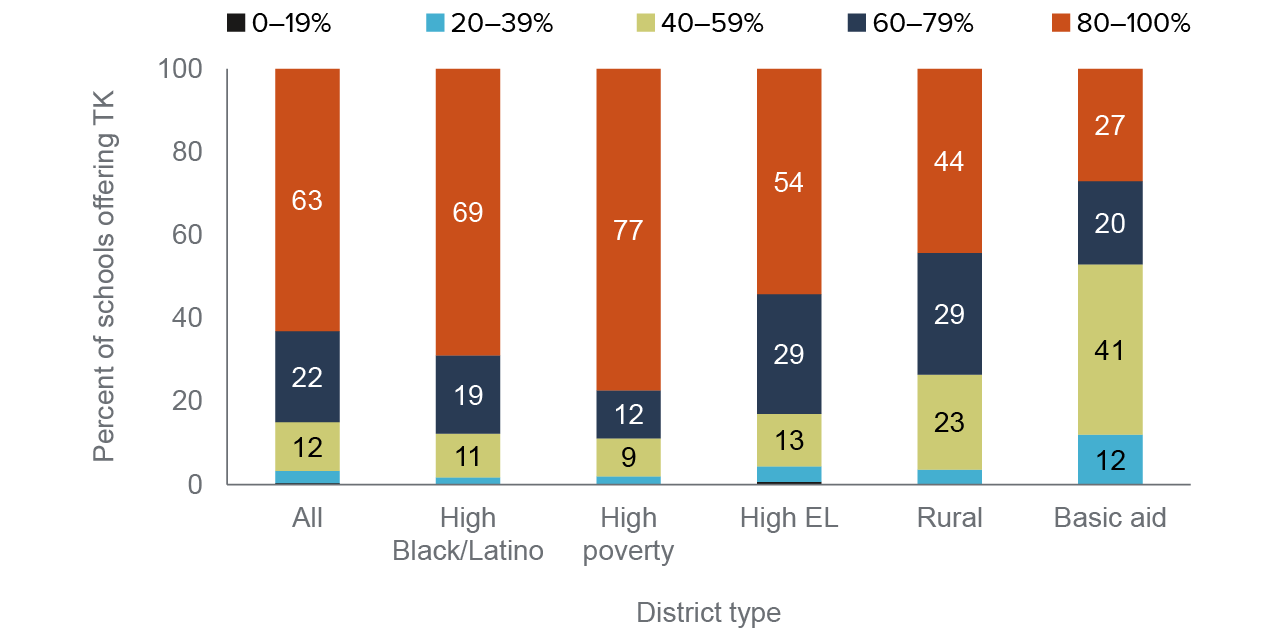
Above, we see that many unenrolled students attend schools that do not offer TK. At 63 percent of the districts that offer TK, more than 80 percent of elementary schools provide the program. However, there are many districts where a much smaller share of schools provide a TK program (Figure 11).
Districts providing TK tend to offer it at the majority of schools
SOURCE: CDE TK enrollment, 2019-20
NOTE: Among districts providing TK and that have more than one elementary school. Includes Los Angeles Unified.
When we examine the rate at which schools offer TK by district type, we find that basic-aid and rural districts are less likely to offer TK in at least 80 percent of their schools: 27 percent and 44 percent, respectively, compared to 63 percent of districts overall. Districts with high proportions of ELs are also somewhat less likely than districts overall to offer TK at 80 percent or more of their schools (54% versus 63%). As reported earlier, the take-up rate among DLLs is relatively high, so these families must nevertheless be finding their way to TK programs.
In contrast, relatively large shares of high-poverty and high-Black/Latino districts provide TK in at least 80 percent of their schools (69% and 77%, respectively).
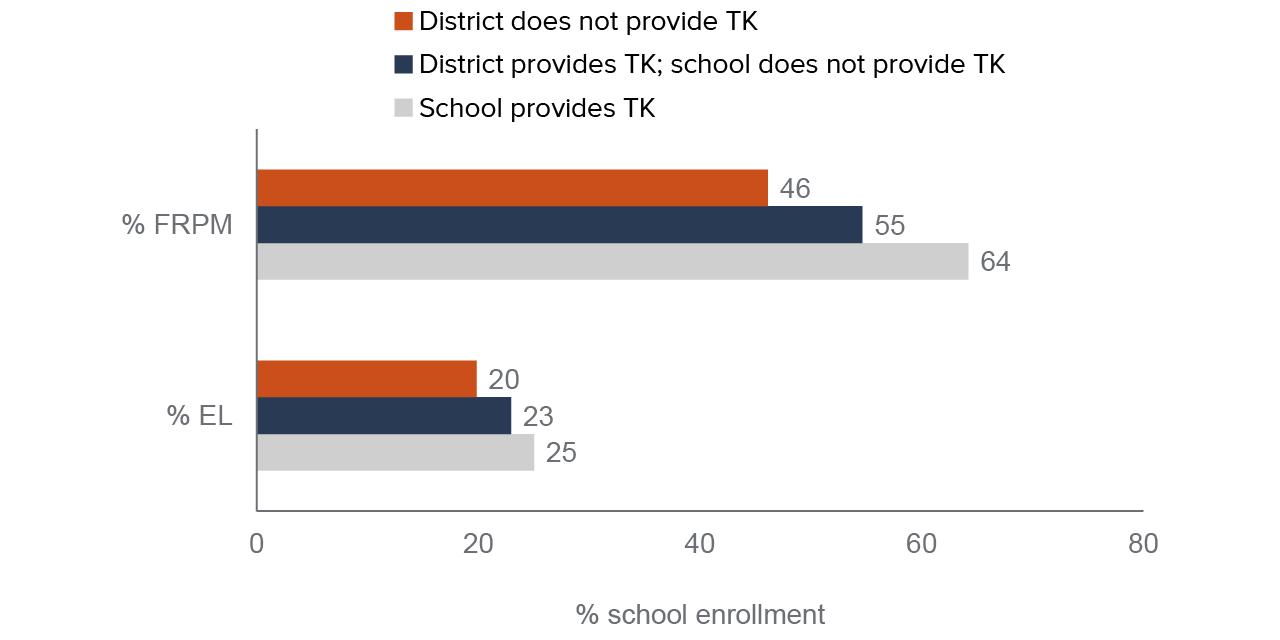
Schools that provide TK have higher shares of low-income students and ELs than schools that do not (Figure 12). It appears districts attempt to offer TK at schools serving higher proportions of students who would most benefit. Among schools that provide TK, the average share of low-income students is 64 percent (55% among schools not providing TK even though their district does; 46% among schools whose districts do not provide TK). Shares of ELs are similarly higher among schools providing TK. When we examine race and ethnicity, we find that districts are also more likely to offer TK at schools serving high proportions of Latino students. Other racial/ethnic groups appear at least slightly underrepresented at schools providing TK (Technical Appendix Figure B11).
Schools offering TK enroll higher proportions of ELs and students from low-income families
SOURCE: CDE TK enrollment, school characteristics, 2019–20.
NOTE: TK Census day count.
Among Schools Offering TK, Does Participation Vary across Student Groups?
Next, we examine take-up rates by student groups at schools that offer TK. We find that even when controlling for whether their school provides TK, Native American students, Pacific Islander, and Black students are less likely to participate in TK than their peers (Figure 13). Students from low-income families are slightly less likely than average to enroll in TK, as are Asian and Filipino students. In contrast, DLL and Latino students are more likely than the average student to enroll in TK at schools that offer the program. And while white students may be less likely to enroll in TK overall (Technical Appendix Figures B5 and B6), when it is offered at their schools, white students are slightly more likely to be enrolled than the average student. Note that this analysis controls for whether schools offer any TK slots, but it does not control for a school’s capacity to provide enough slots for all interested families. Thus, low take-up rates are possibly a combination of family interest, successful advertising of the program, and capacity of the school to offer slots (e.g., space, staffing, and/or planning resources).
When TK is offered at students’ schools, participation still varies across student groups
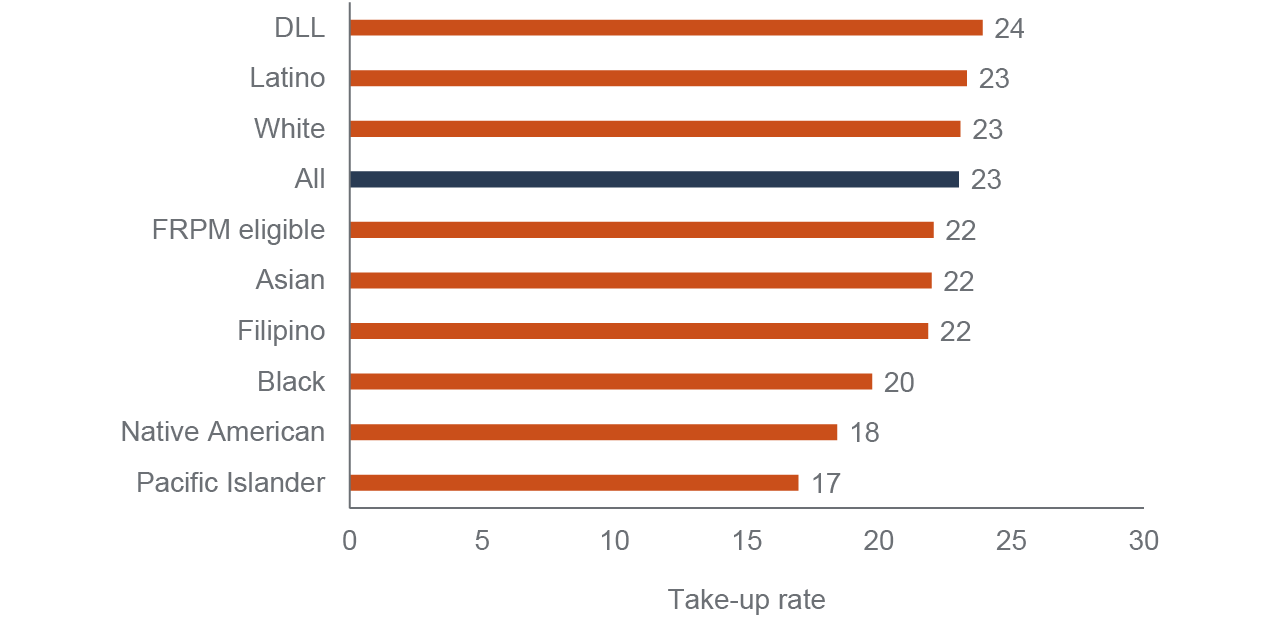
SOURCE: CDE TK enrollment, school characteristics, 2019–20.
NOTES: All schools offering TK. “FRPM eligible” refers to eligibility for free and reduced-price meals, a proxy for low income. Full take-up rate is 25 percent. Excluding Los Angeles Unified drops the school-level DLL take-up rate to 23 percent.
When we examine take-up rates by school type, we find that high-poverty schools are more successfully enrolling TK students than schools overall. Although these differences are relatively small, they hold true across many student groups (e.g., racial/ethnic groups, DLLs, students from low-income families) (Technical Appendix Table B2).
Conclusions and Recommendations
As California’s Transitional Kindergarten program prepares to expand eligibility to include all four-year-olds, our findings highlight some good news about access to the program. Currently, TK serves relatively high proportions of Dual Language Learners and Latino students—some of the students most expected to benefit from universal preschool. In addition, students from low-income families participate in TK at about the same rate as the average student. One possible reason for these findings is that districts are more likely to offer TK at schools serving higher percentages of Dual Language Learners and students from low-income families.
However, there are a number of eligible students who are not currently enrolled in TK—and our analysis suggests some inequities in access. In particular, Native American and Pacific Islander students appear to be consistently underenrolled in TK. Black students are also somewhat underrepresented, particularly when they attend schools that offer the program. These results could be due to a combination of factors, including whether TK is provided at students’ districts and a conveniently located school, the capacity of schools to offer sufficient slots, family interest, the availability of other early education options, and successful advertising of the program.
Districts may face various challenges in expanding TK. Some districts already serve more four-year-olds than are strictly eligible and are likely well positioned to transition to universal TK. Other districts that offer TK are far from reaching all eligible students. Roughly 25,000 unserved children are in districts with TK programs, but TK is not offered at their schools, and another 13,000 attend schools that do offer TK. Finally, about 3,300 unserved children reside in districts that do not offer TK at all. Compared to other districts, basic-aid districts—which are funded primarily through property taxes rather than the state’s student funding formula—are less likely to offer TK at all and less likely to offer it at a solid majority (80% or more) of their schools. Rural districts are also less likely to provide TK at a solid majority of their schools.
We offer the following recommendations to support an equitable expansion of the TK program:
- Monitor enrollment and provide targeted outreach. Targeted outreach might be particularly important to boost low participation rates among Pacific Islander, Native American, and Black students. A better understanding of the various factors driving the choices of families whose children are underrepresented in TK could help educators and policymakers expand the reach of the program.
- Collect data on the enrollment of special education students in TK. Data from the California Department of Education does not include any way to assess whether special education students have equitable access to TK. We recommend including a special education indicator in TK enrollment data. This information is essential to understanding whether the program is provided equitably for these students and whether they have the opportunity to reap the benefits of the program.
- Ensure that all schools offering kindergarten also provide TK. Our findings suggest that districts should consider both increasing the number of schools providing TK and increasing the number of TK slots at schools. Offering new TK programs at schools will likely present more challenges than growing existing classrooms, so educators and policymakers should plan ahead to address potential challenges.
- Provide more incentives for districts to offer TK. Despite not being eligible for LCFF funding, basic-aid districts do serve many Dual Language Learners and students from low-income families—some of the children whom California is most hoping will receive an extra year of kindergarten. And they, like all school districts serving kindergarteners, are required to provide TK. Accountability measures, such as including TK provision in the California School Dashboard, could help encourage both basic-aid and LCFF districts that are not yet providing TK to do so.
- Support rural districts in reaching out to eligible families and expanding TK. Participation among Dual Language Learners and students from low-income families are somewhat lower in rural districts. To help rural districts expand their TK offerings, policymakers may need to provide support to overcome challenges related to larger facilities, long distances, transportation, and staffing constraints.