

Table of Contents
- Key Takeaways
- Introduction
- Employment and Earnings among CalFresh Adults
- Short- and Longer-term Jobs around CalFresh
- Changes in Employment Dynamics around CalFresh Enrollment
- Post-CalFresh Earnings for Adults with Stronger Ties to Work
- Conclusion and Recommendations
- Notes and References
- Authors and Acknowledgments
- PPIC Board of Directors
- Copyright
Key Takeaways
CalFresh provides monthly assistance that helps approximately 4.5 million low-income Californians meet food needs while they experience low and/or unstable incomes. While employment instability can both drive and disrupt CalFresh participation, evidence is lacking on how common instability is, and on employment and earnings trajectories after adults leave CalFresh. Our pre-pandemic analysis finds:
- Most adults new to CalFresh are workers who have at least one longer-term job. Although CalFresh eligibility does not hinge on employment, nearly 90 percent of working participants hold at least one longer-term job. Nearly two-thirds—including half with longer-term work—also hold at least one short-term job.→
- Employment dynamics do not tend to change after a period of CalFresh. Three in four working participants have a longer-term job before CalFresh, and slightly more have such a job after. About 40 percent work short-term jobs before CalFresh, and slightly more do after.→
- Earnings rise for participants who are best-connected to the labor market. Quarterly earnings increase by 68.4 percent for those who work both before and after CalFresh enrollment. Women see smaller growth in earnings than do men.→
- Employment instability is greater among single, working adults than those with children. Working-age adults without children are more likely than those with children to hold short-term jobs, less likely to hold longer-term jobs or to spend more time in longer-term jobs after CalFresh, and more likely to experience unemployment.→
- Earnings growth and job stability differ somewhat across racial/ethnic and language groups. Black and Latino participants are more likely than others to work both short- and longer-term jobs, while white participants appear to be more disconnected from the labor market.→
Introduction
California has an array of social safety net programs aimed at supplementing resources for families with low and often unstable incomes, including CalFresh, the state’s implementation of the federal Supplemental Nutrition Assistance Program (SNAP). Yet job and income instability can make it difficult to not only make ends meet and plan for the future, but also to enroll in and consistently receive stabilizing benefits. These types of instability can also disrupt family resources and circumstances without impacting ongoing eligibility for assistance (Hill et al 2017; Moffitt and Ribar 2008; Ha et al 2020).
For safety net programs like CalFresh to be responsive to individuals in times of need, decision-makers must consider income eligibility as part of a bigger picture of changing employment, family resources, and personal circumstances. This picture also likely varies across demographic groups and geography, given well-known racial/ethnic disparities in poverty along with persistent occupational segregation and lower pay for women in the broader labor market.
Both income instability and short-term jobs have been on the rise in recent years at the national level, with the lowest-income families experiencing higher levels of income instability than all but the highest earners (Western et al 2016; Morduch and Schneider 2017; Hardy and Ziliak 2014). In particular, temporary and short-term jobs have grown among low-paying professions (Kalleberg and Vallas 2018; Lambert and Henly 2013), and the share of jobs that are low-wage is increasing, especially for young adults without college degrees (Howell and Kalleberg 2019). Further, workers in low-wage jobs are less likely to move to higher-paying jobs now than in the past (Andersson, Holzer, and Lane 2003; Schultz 2019). In short, safety net participants in California face a growing low-wage labor market in which jobs are less stable, and mobility has stagnated.
In this report, we examine employment dynamics and instability among low-income adults enrolled in CalFresh, the state’s most universal safety net program. CalFresh is unique among safety net programs in its lack of categorical restrictions; in particular, working-age, childless adults are eligible for food assistance when many other programs are targeted to families with children, or older adults.
National research has provided convincing evidence for long-run, positive effects of SNAP on economic and health outcomes (Bailey et al. 2020; Hoynes, Schanzenbach, and Almond 2016). We have less information on its effects in the near term, even though near-term job instability and income losses can generate SNAP eligibility. Although participants should be able to enroll in SNAP when unstable work leads to income loss—and phase out when stable work generates higher incomes—work and income may not follow this path, or participants may not return to pre-SNAP work patterns after assistance ends. In California, participants often briefly exit and return (churn), and/or exit while remaining eligible (Unrath 2021).
How common is it for CalFresh participants to have unstable employment? Does program participation translate into near-term employment changes? And how do these changes and experiences vary across demographic lines? Toward answering these questions, we leverage California administrative data to provide new descriptive information on employment dynamics for adults who participate in CalFresh.
We explore employment stability and trajectories during a window of roughly four to five years—a span that covers the time before, during, and after an individual enrolls in CalFresh—for participants who newly enrolled in and then exited CalFresh between 2014 and 2017 (which we refer to as a new spell of CalFresh). By examining employment when the state’s economy was growing strongly, we describe a “best case” scenario for employment dynamics. And because an important piece of economic well-being is missing if employment stability is not accompanied by sufficient earnings, we also describe changes in earnings after CalFresh.
This report focuses on working-age adults who access CalFresh and have some connection to the labor force. By definition, these are participants who can experience work stability or instability. Notably, we cannot observe income from self-employment or informal work, and so describe employment only in terms of earnings covered by Unemployment Insurance (UI). While a significant limitation of this work is that we cannot examine the employment dynamics of low-income Californians who are eligible for CalFresh but do not participate, this research is nonetheless important for informing policy to better connect the safety net and economic opportunity.
We first describe employment and unemployment among adults newly participating in CalFresh. Then, we establish that both short- and longer-term jobs are common. Finally, we assess the extent to which short- and longer-term employment persist, and earnings grow, from before an individual’s enrollment in CalFresh to after they leave.
Delving into the work experiences of CalFresh participants can support effective policy development around strengthening the program’s role as a universal safety net program. In forthcoming work using the same data, we separately examine income instability.
Employment and Earnings among CalFresh Adults
This report describes employment for working-age adults who newly enroll in CalFresh and spend a relatively brief period of time with benefits, although this group does not represent the entire CalFresh caseload or the adult caseload. Our focus is motivated by a goal of better characterizing the role of CalFresh in supporting economic opportunity.
Most working-age adults who receive food assistance are employed either around or during the time that they are enrolled, according to prior research. In California, about 63 percent of working-age adults in households with a CalFresh participant have some employment that year, according to California Poverty Measure data. Nationally, survey data show that an estimated three in four nondisabled, working-age SNAP participants are employed in the year before or after they begin receiving benefits (Keith-Jennings and Chaudry 2018).
In this section, we use administrative data on CalFresh participation and on quarterly earnings covered by Unemployment Insurance (UI) to update and add detail to these numbers. We use employment to describe quarters with observed earnings and unemployment to describe quarters without observed earnings, although this likely understates the extent to which participants are actually employed. Technical Appendix A contains details of the data sources and methodology.
Most New CalFresh Adults Are Employed at Some Point
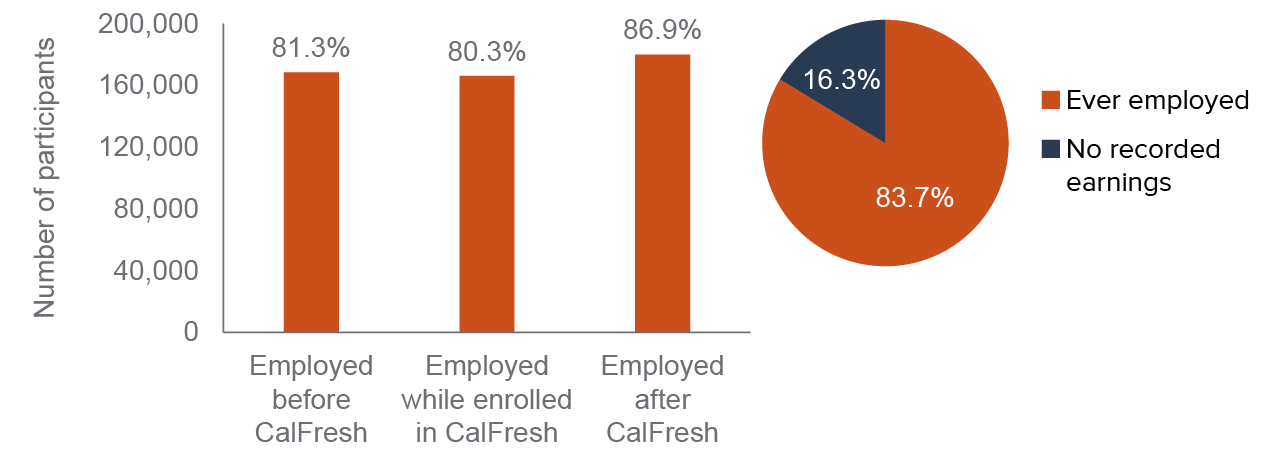
The vast majority—83.7 percent—of working-age adults who join CalFresh have earnings either while they receive CalFresh benefits, or in the 18 months before or after (Figure 1 pie). Among this group, more than four in five work in any given one of those periods (before, during, or after CalFresh enrollment), although the greatest share are employed after their first CalFresh spell ends (Figure 1 bars). However, only half (52%) have earnings in all three periods.
Most working-age CalFresh participants are employed during or near the time they are enrolled
SOURCE: Authors’ analysis of SNAP LDB and EDD Base Wage files, 2012–2019.
NOTES: Columns show adults with any UI-covered earnings in the 18 months before CalFresh, during CalFresh participation, and during the 18 months after going off CalFresh as a share of those who ever have earnings. Pie shows entire analysis cohort. Columns are not mutually exclusive; total analysis cohort includes 247,464 individuals. Those with no recorded earnings in the period are in CDSS CalFresh MEDS records but have no match in the EDD wage database. “Working age” refers to adults age 25–54. See Technical Appendix A for full description of data sources and analysis cohort.
The overall high rate of recorded earnings is not surprising, since this report focuses on CalFresh participants who are likely to be best connected to the labor market: those who have not had CalFresh recently and who spend a relatively short time enrolled. Perhaps more surprising is the high share who work while enrolled in CalFresh, and that it matches the share who work before enrollment.
Average earnings are lower during enrollment than before, however, which reflects the income eligibility component of CalFresh. In a quarter with earnings, working participants on average earn $5,400 during CalFresh enrollment compared to $6,700 in the average quarter before enrolling. Because so many participants work at some point during a CalFresh spell, administrators must make sure to accommodate working schedules of all types when considering procedures for applying for benefits and reporting changes in income.
Participants with no recorded earnings may have other family earnings to fall back on. We find that 50 percent or more of participants who have no employment while enrolled in CalFresh, but do have other adults in their cases, have earnings from another person on the case during that time. Participants who are the sole adult in their case—the majority of people in this analysis—have little possibility of relying on earnings of other case members.
Many CalFresh Adults Experience Some Unemployment
Looking at the 84 percent of adults who have some employment, almost four-fifths (78.7%) also experience at least one quarter without recorded earnings.
The chances of unemployment are much lower than 79 percent in any given quarter—participants who ever work have only around a 20 percent chance of spending any given quarter without recorded earnings. Likely because individuals often become eligible for CalFresh after loss of income or a job, CalFresh participants are progressively less likely to be employed each quarter until they enroll in CalFresh. On average, their earnings also decline over that time frame (see Technical Appendix B, Figure B4 and Figure B5).
Over the span of CalFresh enrollment, however, unemployment begins to fall: 60.6 percent of participants who have any recorded earnings experience at least one quarter of unemployment before enrolling in CalFresh, compared to 53.4 percent while enrolled, and 51.5 percent after exiting a new spell.
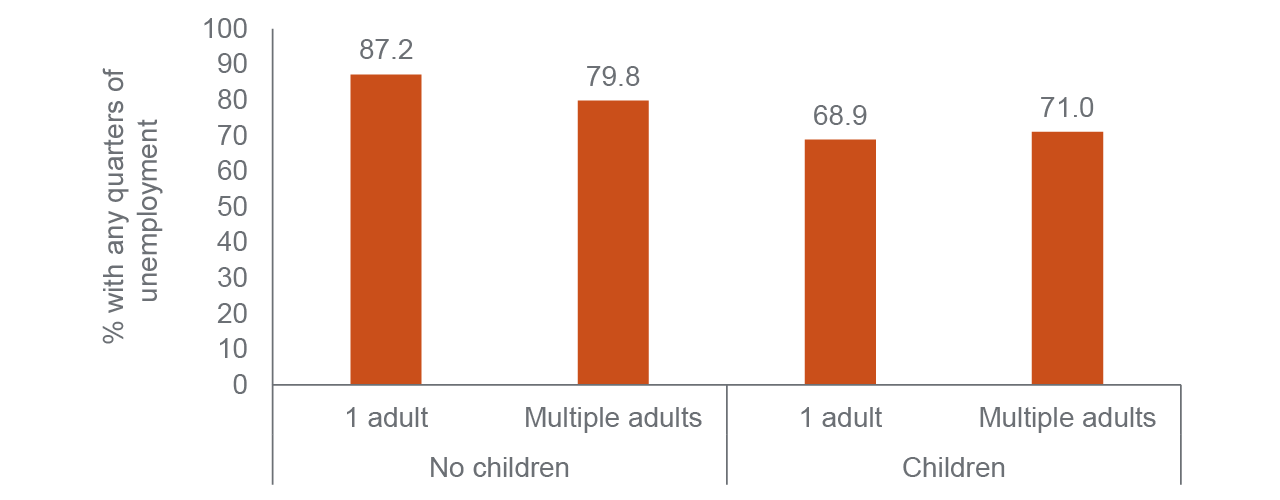
Single adults are more likely to ever experience unemployment than adults in CalFresh cases with other adults or children, and men are more likely than women to have a quarter of unemployment. Overall, 87.2 percent of single adults have one or more quarters of unemployment (Figure 2), compared to 71.3 percent of those in cases with other adults and/or children. On average, 81.8 percent of men ever experience unemployment around CalFresh, compared to 75.3 percent of women.
Men and women living with children see diverging trends on the chances of unemployment. Women with children under 6 are more likely than women with children ages 6 to 17 to experience unemployment, while the reverse is true for men. These differences persist when we account for geography, other demographic characteristics, and participation in other safety net programs including CalWORKs and SSI/SSP (see Technical Appendix Table C1). The opposing trends for adults with young children in particular—where women are more likely and men are less likely to ever be unemployed if they have younger children—could reflect gendered differences in expectations about who will shoulder child care, as well as potential difficulties in accessing affordable child care.
Single adults enrolled in CalFresh are more likely than those with children to experience unemployment
SOURCE: Authors’ analysis of SNAP LDB, SSNSORT, and EDD Base Wage file data, 2012–2019.
NOTES: Number of adults describes number of people ages 18 or older in CalFresh case, rather than number age 25–54. Chart shows share with any quarters without UI-covered earnings among those who ever have some UI-covered earnings. See Technical Appendix Table B8 for additional detail, and Technical Appendix A for discussion of family composition.
Annual employment patterns also differ between CalFresh adults based on family composition, according to California Poverty Measure data (2014–17). Single adults are as likely as other working-age adults to have full- or part-time employment—with about two-thirds working full-time, and a quarter working part-time. Yet on average just 24 percent of single, working-age CalFresh participants have full-time, full-year jobs, compared to 38 percent of working-age adults in families with other adults or children.
Why might we see differences in quarterly employment dynamics between single, childless adults and others? On average, the childless adults who enroll in CalFresh might be deeper in poverty relative to adults with children, and thus more disconnected from the labor market. When looking at all active CalFresh participants, for example, adults in CalFresh cases composed exclusively of working-age adults are far more likely to experience homelessness (39%) than those in cases with children (3%) (Danielson 2020).
Childless adults in our cohort also are more likely than others to eventually receive SSI/SSP benefits, suggesting that employment patterns may differ for childless adults who are disabled and unable to work, but not connected to SSI/SSP. In sum, program administrators at the national level describe childless adults as the most difficult SNAP population to reach, and this is likely also the case in California (Wheaton et al. 2021).
Demographic differences around unemployment are not limited to family composition. We note above that white CalFresh participants make up a disproportionate share of those with no recorded earnings. Even among participants with some recorded earnings, white participants are more likely than those in other racial/ethnic groups, or with no reported race/ethnicity, to have one or more quarters of unemployment, when we control for demographic and geographic characteristics. Latino and Black participants are least likely to experience extended unemployment. This may indicate that, among CalFresh participants, white adults are more disconnected from the labor market, while Latino and Black adults are eligible for assistance despite being employed.
Short- and Longer-term Jobs around CalFresh
Even among working CalFresh participants, disruptions in employment are common. Indeed, we expect to see high levels of job instability given that nationally, earnings are most volatile for people near the bottom of the income distribution (Bollinger, Hokayem, and Ziliak 2020; Hardy and Ziliak 2014; Western et al. 2016). In this section, we look more closely at employment dynamics in the time around the start of a new CalFresh spell by describing short- and longer-term employment.
Single-quarter jobs—or short-term jobs—start and end in the same quarter (following Hyatt and Spletzer (2017)). Because the job stint is brief and temporary, a single-quarter job may point to disruption in both employment and family resources. However, these jobs are by no means the only type of job instability that participants experience from quarter to quarter.
Full-quarter jobs—or longer-term jobs—occur when a person has earnings from the same employer for three quarters in a row; when this happens, we flag the middle quarter as one in which the employee had three full months in the same job (following Bailey and Spletzer (2021)). Full-quarter jobs point to an ongoing connection with a single employer.
Both single-quarter and full-quarter metrics generate conservative estimates of how common it is to experience short- and relatively longer-term employment. To be concise, however, we use short-term to describe single-quarter jobs and longer-term to describe full-quarter jobs throughout this report. In places, we supplement them with other measures of employment dynamics; see Technical Appendix A for a complete discussion.
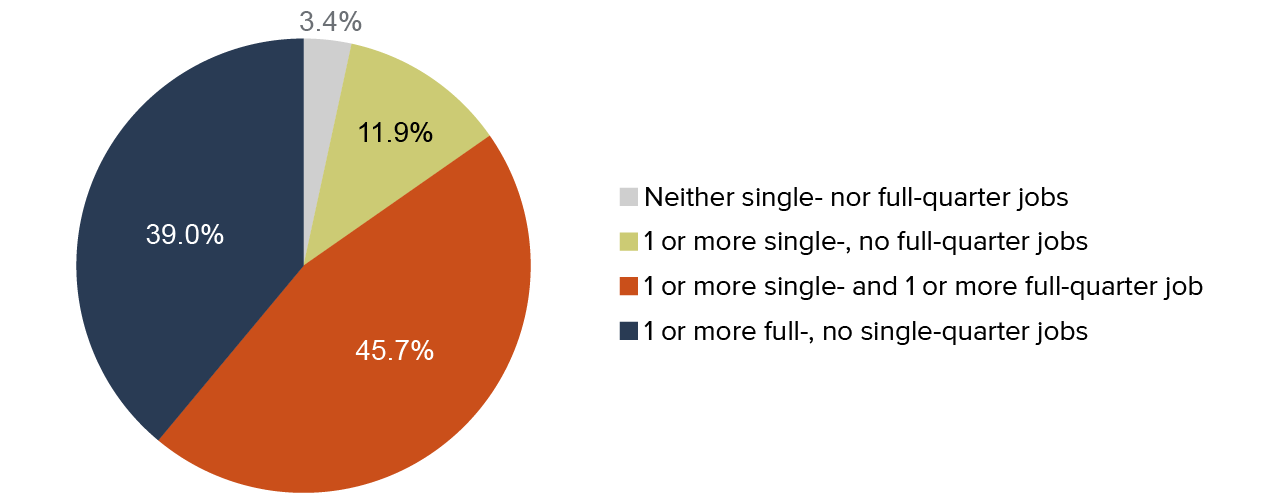
Overall, 45.7 percent of participants who work before, during, and/or after a new CalFresh spell hold both short- and longer-term jobs (Figure 3). This is higher than the share who hold at least one longer-term job but no short-term job (39 percent), and much higher than the 11.9 percent who have one or more short-term jobs but no longer-term job. About half of participants who work any short-term job do so more than once (49 percent), and nearly all who work any longer-term jobs have more than one, or more than one quarter in the same one (91.5 percent).
Most working CalFresh participants hold at least one longer-term job, but short-term jobs are common
SOURCE: Authors’ analysis of SNAP LDB, SSNSORT, and EDD Base Wage file data, 2012–2019.
NOTE: Chart shows incidence of single- and full-quarter employment among cohort adults with recorded earnings at any point before, during, or after a new CalFresh spell. A single-quarter job starts and ends in the same calendar quarter; a full-quarter job is the middle quarter among three consecutive quarters with the same employer.
Whether employment dynamics differ across demographic groups and geography could reflect labor market inequalities such as uneven geographic distribution of high-paying jobs, discrimination in hiring, and occupational segregation. We find significant differences between participants based on case composition, and smaller differences across gender, race/ethnicity, and preferred language of written communication for CalFresh materials (see Technical Appendix Table C1). Although we might expect to see large differences across geography, given variation in local and regional economies, we find only small variation across the state.
Single Adults Are Less Likely than Those with Children to Work Longer-Term Jobs
Among single, working adults, 79.5 percent have at least one full-quarter job, compared to 89.2 percent of those in cases with others; 65.0 percent have at least one single-quarter job, compared with 51.2 percent of those in cases with others (see Technical Appendix Table B8). This difference is consistent with the picture of unemployment described above: that single adults in CalFresh are a distinct population in their employment trajectories and needs. Also consistent with the picture above, men are more likely than women to ever hold a short-term job, and less likely to hold a longer-term job.
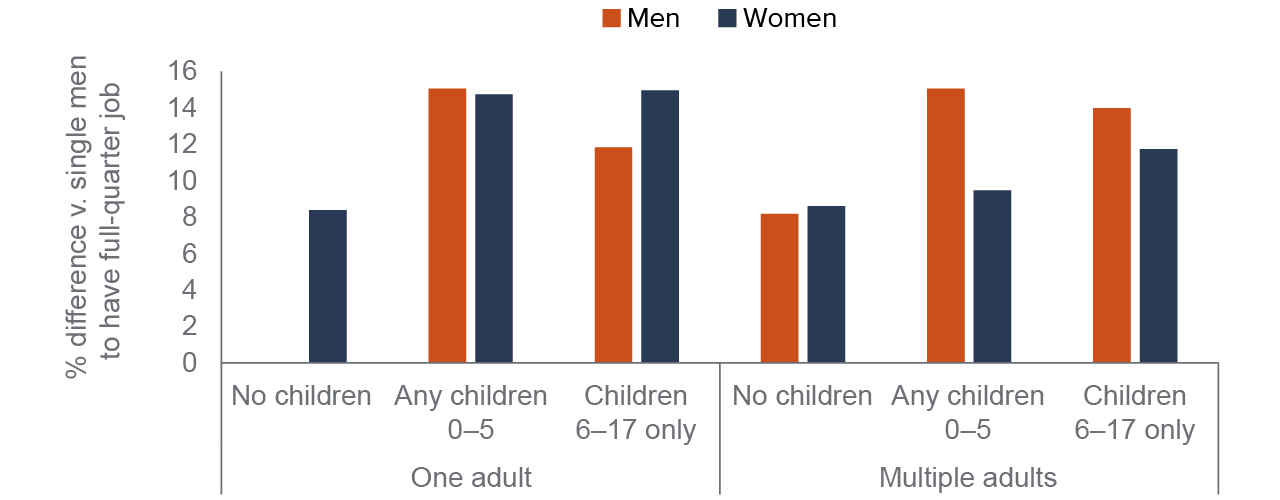
Furthermore, working single men are by far least likely to ever hold longer-term employment, holding other demographic characteristics constant (Figure 4). Men in cases with children are 11.8 percent to 15.1 percent more likely than single men to have one or more longer-term jobs; men in cases with other adults are 8.2 percent more likely.
While women of all case types are more likely than single men to work longer-term jobs, fewer differences occur among women based on case composition. However, women in cases with children have much higher chances than other women do of any longer-term employment if they are the sole adult in their case.
People in cases with children are substantially more likely than single men to have longer-term jobs
SOURCE: Authors’ analysis of SNAP LDB, SSNSORT, and EDD Base Wage file data, 2012–2019.
NOTES: Chart shows percent difference from reference group—single men—in chances of holding a full-quarter job at any point before, during, or after CalFresh enrollment, for those who work at any point, based on linear probability models regressing incidence of full-quarter jobholding on demographic and other characteristics. A full-quarter job is the middle quarter among three consecutive quarters with the same employer. All estimates significantly different from reference group at the p<.001 level; see Technical Appendix Table C1 for detailed description and untransformed regression output.
Black and Latino Adults Are Most Likely to Work Short-Term Jobs
Race/ethnicity and whether or not participants receive case materials in English—a loose proxy for English proficiency and immigrant status—are associated with differences in employment stability, but on a substantially smaller scale than case composition is. Although we might expect groups who are more likely to hold short-term jobs to be less likely to hold longer-term jobs, Figure 5 indicates that this is not the case.
Overall, Black, followed by Latino, participants are most likely to work one or more single-quarter jobs, and participants who receive case materials in a language other than English are more likely to do so than English speakers. White and multiracial participants are least likely to work one or more full-quarter jobs, as are those with other-language case materials.
Holding other demographic and geographic characteristics equal, Black participants are 3.8 percent more likely than Latino and 12.4 percent more likely than Asian/Pacific Islander (API) participants to ever have a short-term job (where API participants are least likely to have such a job). On the other hand, while there are no large differences across most race/ethnic groups in holding short-term jobs, white and multiracial participants are 3.7 percent and 1.8 percent less likely than others, respectively, to hold any longer-term jobs.
The group that does follow an anticipated trend and is consistently worse off—although modestly so—are people who receive case materials in languages other than English: participants in this group are 2.1 percent more likely to have short-term jobs and 3.2 percent less likely to work any longer-term jobs than those who receive English-language materials.
Black and Latino adults are more likely than others to hold both short- and longer-term jobs
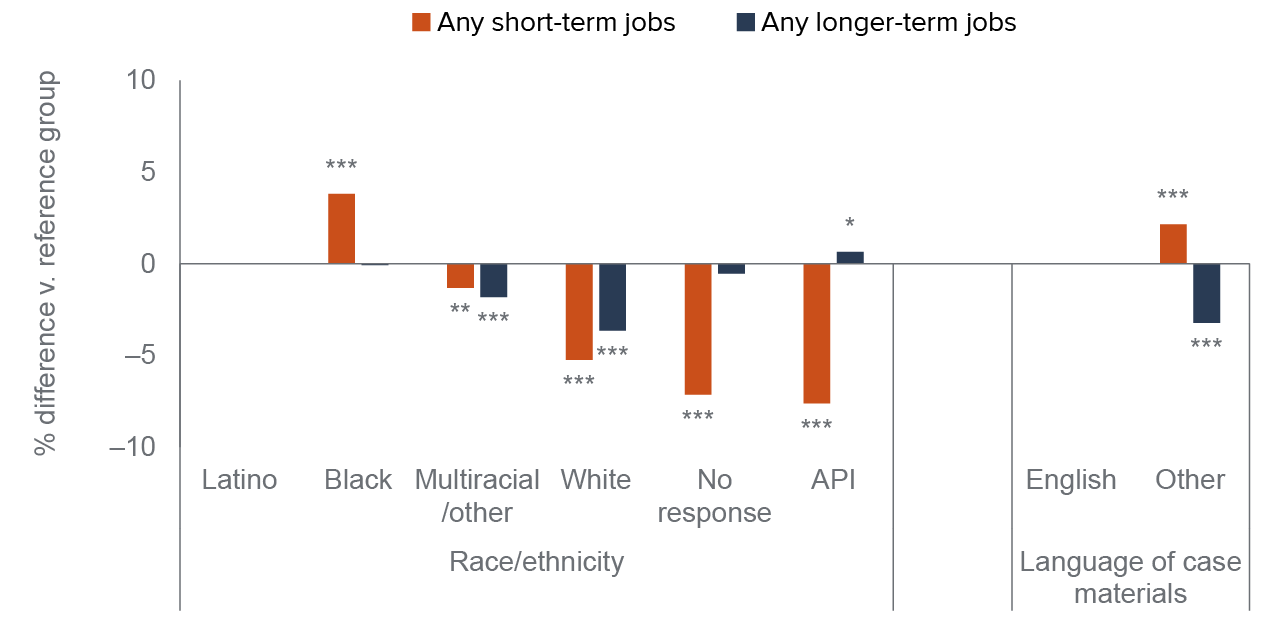
SOURCE: Authors’ analysis of SNAP LDB, SSNSORT, and EDD Base Wage file data, 2012–2019.
NOTES: Chart shows percent difference from reference group (Latino and English-speaking, respectively) in chances of experiencing type of job at any point before, during, or after CalFresh, for those who work at any point, based on linear probability models regressing incidence of each event on demographic and other characteristics. Columns sorted by size of (transformed) coefficient on any single-quarter job. *** indicates coefficient significant at the p<.001 level, ** indicates significant at the p<0.01 level, and * indicates significant at p<0.05 level; columns without asterisks are not significantly different from reference group. API refers to Asian/Pacific Islander. See Technical Appendix Table C1 for detailed description and full regression output.
Despite regional differences in labor markets that might point to major differences in employment dynamics based on geography, we find only small variation across the state. The largest difference is between participants in Central Valley, Sierra, and Central Coast counties and those in Los Angeles and northern counties; given similar demographic characteristics, the former are about 6 percent more likely than the latter to ever hold short-term jobs (see Technical Appendix Table C1).
Changes in Employment Dynamics around CalFresh Enrollment
Do the employment dynamics of working participants track directly with when they gain and lose income eligibility, and when they enroll in CalFresh? In the following section, we describe the incidence of short- and longer-term jobs before, during, and after a new CalFresh spell.
Participants Are More Likely to have a Short- or Longer-Term Job after CalFresh
In general, participants might have lower chances of working either short- or longer-term jobs while enrolled in CalFresh than in the six quarters before or after a new spell, simply because work is slightly less common during assistance (Figure 2). However, even those who do work while enrolled are less likely to have one or more single-quarter jobs than those who work before or after assistance.
Both short- and longer-term jobholding become more likely after a new CalFresh spell ends, by a small margin. On average, 35.8 percent of participants working before they began CalFresh have at least one single-quarter job, compared to 28.5 percent working while enrolled, and 36.4 percent working after (Figure 6).
Short- and longer-term jobholding fall while individuals participate in CalFresh participation, and rebound after
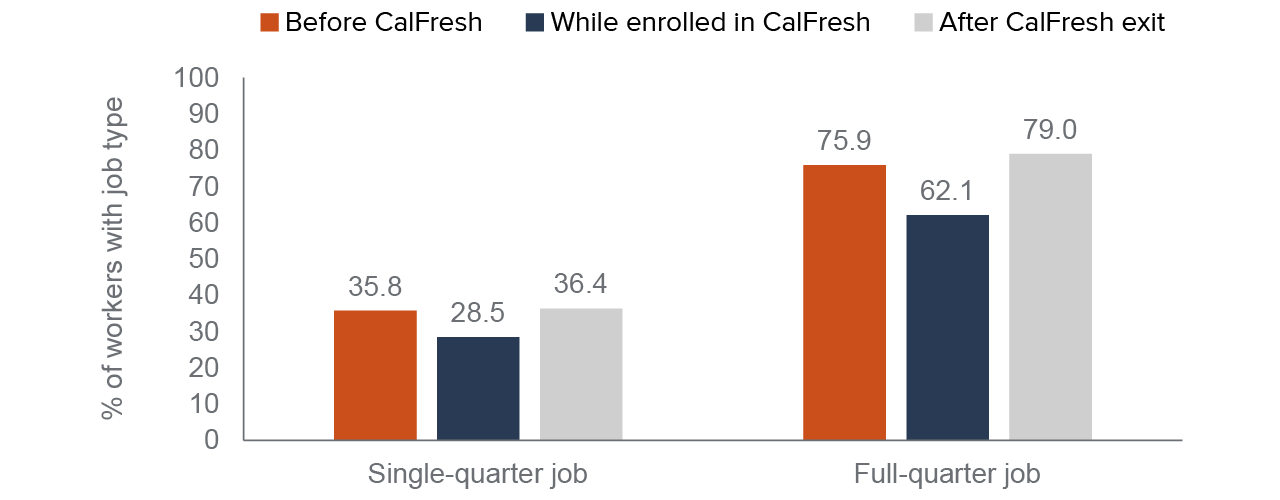
SOURCE: Authors’ analysis of SNAP LDB, SSNSORT, and EDD Base Wage file data, 2012–2019.
NOTES: Chart shows share of participants with earnings in the given period who work any single- or full-quarter jobs in the time period, where “after CalFresh exit” describes exit from a new spell. A single-quarter job starts and ends in the same calendar quarter; a full-quarter job is the middle quarter among three consecutive quarters with the same employer.
If having—and leaving—a short-term job is a common reason for income loss that makes someone eligible for CalFresh, single-quarter jobs might naturally be more common before CalFresh than during enrollment. We do find that workers are most likely to separate from a job where they earn the bulk of their income in the quarter before enrolling in CalFresh, for example, as shown in Figure 7.
The decline in longer-term employment for people who work while enrolled in CalFresh is more difficult to interpret. Since our measurement of a full-quarter job requires three consecutive quarters with a single employer, and the median CalFresh spell lasts for two quarters, a worker who loses a job just before CalFresh would be less likely to have enough consecutive quarters of work during CalFresh for one of them to be a full-quarter job—even if that job continues for all six of the quarters following CalFresh that we can observe. This is somewhat borne out with longer-term jobs rebounding in the period after CalFresh. However, nearly two-thirds of workers still have full-quarter employment while enrolled in CalFresh.
Employment dynamics primarily change in quarters near and during CalFresh enrollment
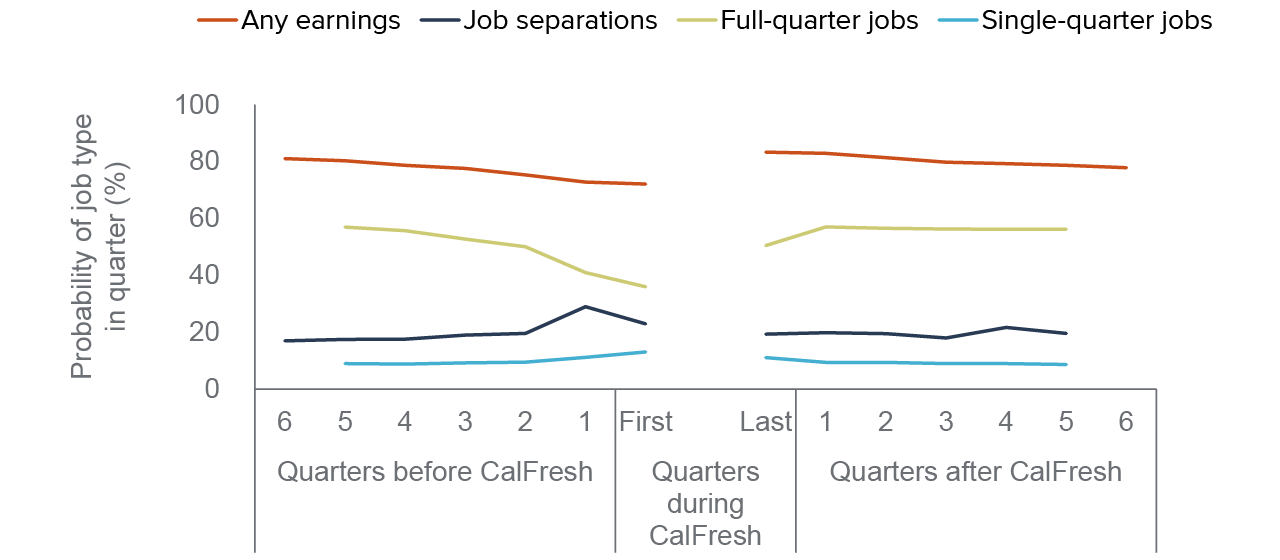
SOURCE: Authors’ analysis of SNAP LDB, SSNSORT, and EDD base wage files, 2012–2019.
NOTES: Chart shows quarterly probability of each type of employment event for participants who work at any point around CalFresh. Quarters during CalFresh other than the first and last are omitted because this varies for individuals in the analysis cohort. The small share who spend just three months enrolled have that quarter assigned as their first quarter during CalFresh, and are assigned a missing value for their last quarter during CalFresh. Estimates for the sixth quarters before and/or after CalFresh are omitted when metrics are not calculable in those quarters. Job separations describes incidence of leaving the employer from which a person earned the majority of their UI-covered earnings. Estimates drawn from results of linear probability models with individual fixed effects in Technical Appendix Table C3; chart shows sum of coefficient and constant for each model. See Technical Appendix Figure B5 for additional detail.
The resurgence in chances of short-term jobholding after a new CalFresh spell (a very small but statistically significant increase) paints a mixed picture of trajectories. That is, a baseline of instability may be common outside of periods of assistance. After all, even though separating from a primary employer is most common before CalFresh enrollment—three in four workers experience this—two in three workers leave a primary job after their new CalFresh spell ends. Still, while the share with longer-term jobs after CalFresh is only slightly higher than the share holding them before enrollment, the increase is statistically significant when we account for differences in demographic and geographic characteristics.
Much of this mixed picture maps on to whether or not participants return to CalFresh after the end of a new spell. Even accounting for differences in earnings before and after CalFresh enrollment, people who return to CalFresh are less likely to have stable employment after their first new spell. When we look separately at leavers and returners, we find that adults in the 60 percent of the cohort who do not re-enroll in CalFresh in the next 3 to 18 months are 13.3 percent more likely to have longer-term jobs in that time than they were before enrolling, and 26.3 percent less likely to have short-term jobs (see Technical Appendix Table C2a). Those who return to CalFresh experience the reverse set of odds. These differences also appear in the likelihood of primary job separations.
Although this does not alter the broader finding that the odds of short- and longer-term jobholding are slightly higher after a new CalFresh spell than before, it highlights a way in which CalFresh appears to be responsive to unstable employment. And whether or not CalFresh returners end their first spell because they earn above the income eligibility threshold, the differences in employment dynamics for leavers also suggests that job instability may play a role in churn off and on CalFresh. Policymakers and administrators may want to consider ways to improve transitions off CalFresh, to reduce churn related to short-term employment.
Differences in Employment Dynamics between Groups Are Small during and after CalFresh Enrollment
All demographic groups in our cohort are less likely to hold single- and full-quarter jobs while enrolled in CalFresh than before or after—even accounting for lower employment during assistance. Overall, the chances of short- and longer-term employment rebound after exit. Although some groups may hold short- or longer-term jobs at higher rates than others, job trajectories may vary little between demographic groups over the course of CalFresh participation. However, there are larger differences across groups in chances that participants may hold longer-term jobs than short-term jobs.
Adults with children are more likely than others to ever hold longer-term jobs—on average before, during, and after CalFresh enrollment (see Technical Appendix Table B8). They also have very slightly higher chances than single adults of holding any full-quarter jobs after a new CalFresh spell, when we account for other characteristics (see Technical Appendix Table C2).
For short-term jobholding, patterns also vary based on case composition. During CalFresh enrollment, women in cases with other adults or with older children are 4 percent to 9 percent more likely than others to work short-term jobs during CalFresh; the likelihood is 10 percent to 13 percent higher after CalFresh. This is despite women being less likely overall to ever hold a single-quarter job around the time they enroll in CalFresh. By contrast, women in cases with both other adults and young children are less likely to hold short-term jobs while enrolled (by 16.5%), as are men in cases with other adults but no children.
Returning to longer-term jobholding, participants who receive case materials in languages other than English are more likely to hold longer-term jobs while enrolled CalFresh than English-language participants, as are Black and Asian/Pacific Islander participants, relative to those in other race/ethnic groups (by about 5%, in all three cases). Both while enrolled in CalFresh and after exit, Black and Asian/Pacific Islander participants are the most likely to have one or more short-term jobs, by 10 to 15 percent. Multiracial participants see similar rates after exit. For details on regional differences, see Technical Appendix C.
Do Job Dynamics Persist after CalFresh?
In this section, we examine the extent to which short- and longer-term employment persist after participants leave CalFresh. This analysis requires that we zoom in on smaller cohorts, such as the 24 percent who have any single-quarter jobs before CalFresh, or the 82 percent who are not continuously employed with a single employer in that time frame. These cohorts are shown in color in Figures 8 and 9.
The right-hand column in Figure 8 shows that 68.8 percent of participants who spend any time in short-term jobs before CalFresh have fewer such quarters after, if they are working after. This result seems at odds with the finding that roughly equal shares of workers have single-quarter jobs before and after CalFresh. It suggests that many workers with short-term jobs after CalFresh are holding them for the first time, and that short-term jobs are a regular feature of the low-wage labor market. Since this finding comes out of a particularly small share of the cohort, it is worth noting that we see a similar pattern among the larger share (50%) who leave a primary job before CalFresh (59% have fewer job separations after exit).
Participants see fewer short-term jobs after CalFresh
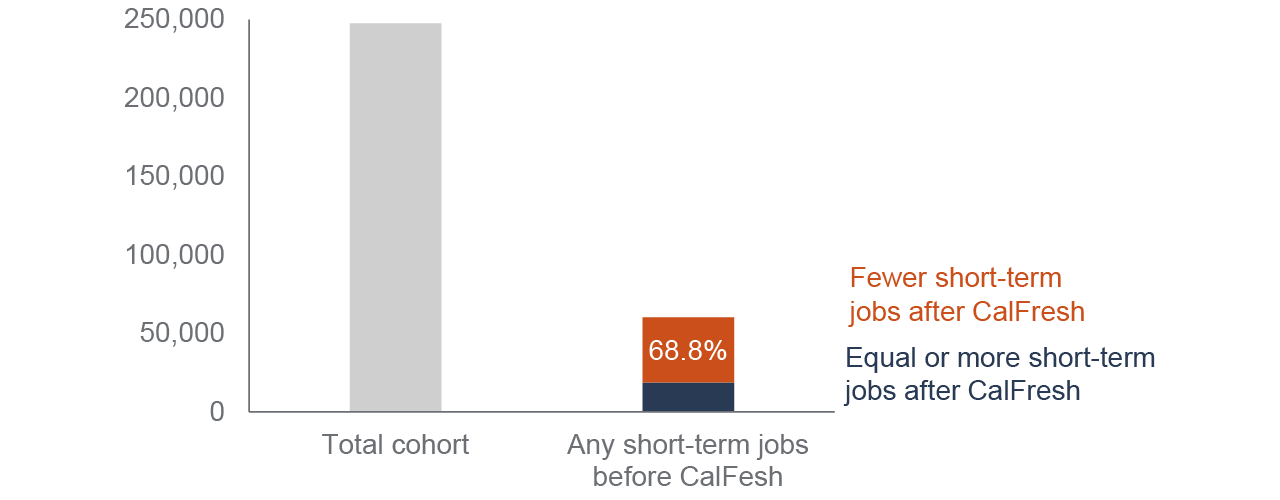
SOURCE: Authors’ analysis of SNAP LDB, SSNSORT, and EDD Base Wage file data, 2012–2019.
NOTE: Left-hand column shows full analysis cohort, for scale—including those with no recorded earnings during or near CalFresh enrollment—while right-hand column shows the 24 percent of the cohort who have any single-quarter jobs before CalFresh. A single-quarter job starts and ends in the same calendar quarter.
Participants tend to have longer-term employment both before and after CalFresh—and especially after exit, for those who do not return to CalFresh—but most have the same amount or less after CalFresh as they did before. Just 39.2 percent of those not employed in the same job in every quarter before CalFresh spend more time in full-quarter jobs after, as shown in the right-hand column in Figure 9. Together, these findings raise questions for future research on what causal role CalFresh may play in changing employment dynamics.
Participants are unlikely to see additional time in longer-term jobs after CalFresh
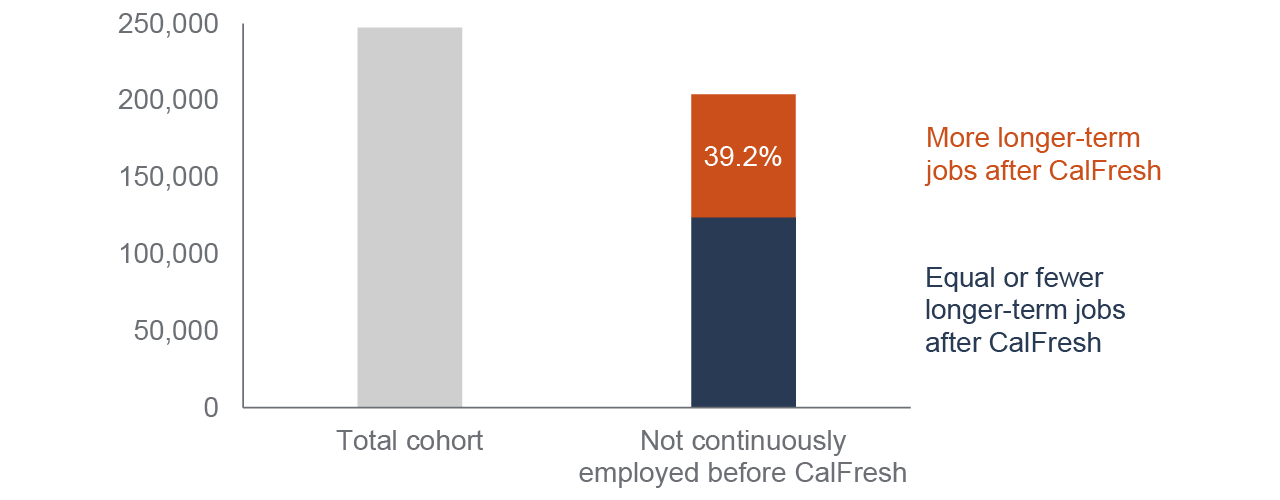
SOURCE: Authors’ analysis of SNAP LDB, SSNSORT, and EDD Base Wage file data, 2012–2019.
NOTE: Left-hand column shows full analysis cohort, for scale—including those with no recorded earnings during or near CalFresh enrollment—while right-hand column shows the 82 percent of the cohort who spend any quarters without full-quarter jobs before CalFresh. A full-quarter job is the middle quarter among three consecutive quarters with the same employer.
Across geography and demographic groups, we see some small differences in the odds that participants will work fewer short-term jobs after CalFresh, although the odds are high regardless of demographics. Women—particularly Asian/Pacific Islander, Latina, and white women—are slightly more likely than men to hold fewer short-term jobs after CalFresh than before (by about 5%), regardless of whether or not they re-enroll, and without working for less time than men do after leaving CalFresh (see Technical Appendix Table C4 column 6). Participants receiving case materials in languages other than English and those in cases with others are up to 5 percent less likely to hold fewer short-term jobs after CalFresh than before (see Technical Appendix Table C4 column 4). Finding a new employer after CalFresh rather than continuing with or returning to a previous employer is associated with lower odds (nearly 50%) of having fewer short-term jobs.
Differences by demographic and geographic group are larger in full-quarter jobholding. Women—again particularly Asian/Pacific Islander and Latina participants—are more likely than others to see gains with longer-term job holding, by about 20 percent or more (see Technical Appendix Table C4, column 3). And people who find new employers after CalFresh are 41.4 percent more likely than others to have a full-quarter job in that time period.
Men who receive case materials in a language other than English are 4.8 percent less likely to see gains, while people in multiple-adult cases and multiple-adult cases with older children are more likely to see gains. The trends for people across case composition differ between those who re-enroll in CalFresh and those who do not; among those who re-enroll, single people are least likely to see increased time in full-quarter jobs, while the reverse is the case among those who exit.
Post-CalFresh Earnings for Adults with Stronger Ties to Work
Looking at the trajectories of median earnings among those with any in each quarter, we broadly expect to see growth after CalFresh. In the six quarters before CalFresh, median quarterly earnings fall from $8,700 to $7,200—largely in the last quarter before beginning CalFresh, and they rise over the six quarters after CalFresh from $8,700 to $9,900 (see Technical Appendix Table B6).
We look at a selected group within the cohort of adults new to CalFresh to shed light on the extent to which earnings grow after CalFresh—the 58 percent with UI-covered earnings both before and after a new spell. Looking at this subset allows us to consider earnings growth in relative terms (avoiding the challenge of describing change from no earnings to some, or vice versa), but by definition biases our findings toward those who are best connected to the labor market.
On average, people in this relatively well-connected group see their maximum earnings increase by 68.4 percent after a new spell of CalFresh. Some of this growth is equitably distributed, in the sense that participants who earned the least before CalFresh see the greatest gains after: earning an additional $100 in the highest-earning quarter before CalFresh is associated with 1.7 percent less in growth (see Technical Appendix Table C5).
Across demographic groups, growth in earnings after CalFresh is uneven. Holding other factors constant, white men and Black women see the greatest increases in earnings after CalFresh: more than 60 percent more than Latina participants, who see the smallest growth in earnings among gender and race/ethnic groups, at about 36 percent. This reflects large differences among those who do not re-enroll in CalFresh in the near term. Among those who do return, participants of different race/ethnicities and genders see similar levels of earnings growth.
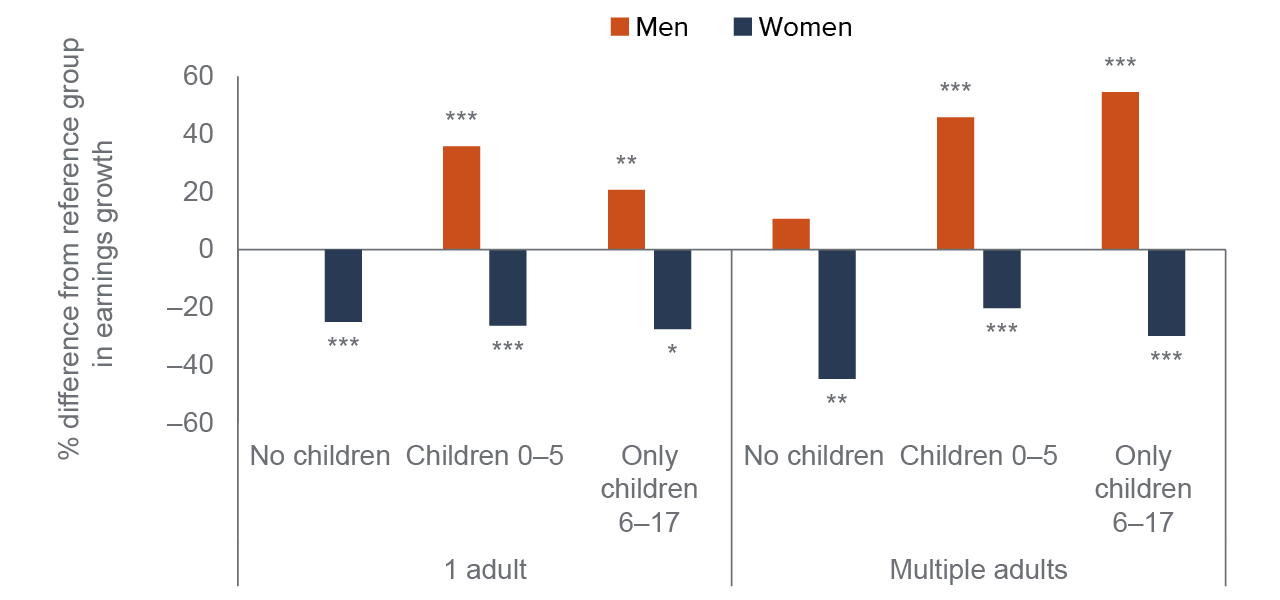
Men in cases with children, too, see dramatically higher growth in earnings after CalFresh than men who are single, by up to 55 percent. Overall, despite seeing increased time in longer-term jobs after CalFresh, most women experience smaller increases in earnings than men do (Figure 10). This suggests that on average, women working after exiting CalFresh do so more consistently, but with lower wages and/or hours than men receive, amplifying the extent to which men earn more than women prior to enrolling in CalFresh.
Women see less growth in earnings than men, across the board
SOURCE: Authors’ analysis of SNAP LDB, SSNSORT, and EDD Base Wage file data, 2012–2019.
NOTES: Chart shows percent difference for each group from reference group (single men, who would be first column) in percent change in earnings between highest-earning quarter before CalFresh and after, for those with earnings in both periods. Adults describes number of adults ages 18 and up in CalFresh case. OLS model associates percent change in earnings with demographic and other characteristics. *** indicates coefficient significant at the p<.001 level, ** indicates significant at the p<0.01 level, and * indicates significant at p<0.05 level; columns without asterisks are not significantly different from reference group. Note that differences between estimates for women are not statistically significant, meaning they see similar change in earnings regardless of case composition. See Appendix Table C5 for detailed description and full regression results.
For people receiving CalFresh materials in languages other than English, earnings increases are smaller than for those with English-language materials, by at least 40 percent for men. The disparity persists regardless of whether participants fully exit CalFresh, or begin a new spell in short order, and is congruent with the overall finding that they are less likely to spend more time in longer-term jobs, or less time in short-term jobs, after CalFresh.
The earnings differences are also notable for people who have no new employers after CalFresh—those who either continue with or return to a previous employer. For this group, earnings do not grow as much, but instead are 38.5 percent less than for those with a new employer. This contributes to a mixed picture of the role that finding a new employer after CalFresh plays. New employers may appear to offer participants upward economic mobility through greater earnings at the risk of higher job instability, given our findings that new employers are associated with increases in longer-term jobs, but with reduced odds of improvement on short-term jobs. Future research could shed light on the role that employers play in CalFresh enrollment and outcomes.
Conclusion and Recommendations
This report paints a picture of both stability and instability in employment dynamics of CalFresh adults. Work is extremely common for participants, but unemployment and job instability are prevalent even in good economic times.
On average, working participants are less likely to have short-term work while enrolled in CalFresh than before, but as likely to hold a short-term job after exiting. Furthermore, the chances of holding a slightly longer-term job barely go up after CalFresh. For those who do not soon return to CalFresh, employment dynamics differ relative to those who do re-enroll. The 60 percent leaving CalFresh are much less likely to have a short-term job after participating than before, if they have employment. The 40 percent who start a new spell are much more likely to hold a short-term job.
We do find a few potentially positive results. Participants in short-term jobs before CalFresh—which may signal instability—tend to have fewer such jobs after, regardless of whether or not they begin a second spell. Similarly, earnings grow substantially after CalFresh for people who are relatively well connected to the labor market, regardless of whether or not they re-enroll in the near term, with those who earned the least before their first spell seeing the greatest growth.
For policymakers, differences between those who leave and those who return to CalFresh raise questions about how to improve transitions off CalFresh. Mounting evidence suggests that work is still needed to reduce churn off and on CalFresh for those who remain income-eligible. Yet the findings here suggest that job instability may also play a role in churn, lifting participants out of or dropping them back into income eligibility.
Federal action to create more flexibility around income eligibility during recertification periods could reduce or prevent such churn. Future research could investigate the extent to which CalFresh participation itself is the cause behind less job instability for people who leave the program, in order to better assist those who return—and to better understand disparities in outcomes among CalFresh leavers.
The vast majority of new, working-age CalFresh participants are connected to the labor market. To this end, administrators should ensure that the process of getting and keeping CalFresh benefits accommodates the needs of working participants—for example, keeping call centers open outside traditional working hours, and providing online self-service options. Yet even those with employment might struggle to meet work requirements for childless adults, since job instability is common.
We also find some concerning disparities between participants based on race/ethnicity, gender, geography, and case composition. To some extent, these disparities point to differences in the labor market and in who may ultimately become eligible for and access CalFresh. We might find different conclusions if everyone eligible for CalFresh participated, and received it in every month they were income eligible. However, disparate experiences and outcomes raise questions about how CalFresh can better serve each group. As one of the few safety net programs for which they are eligible, for example, CalFresh offers a unique opportunity to reach single adults. Uneven changes in employment for women and consistent disadvantage for people receiving case materials in languages other than English point to additional need for improvement. Further research could help identify what may be driving differences in job instability around CalFresh across demographic groups, to indicate how policy might reduce gaps.
As policymakers consider ways to strengthen the link between safety net participation and economic mobility, these facts about job stability and earnings around CalFresh enrollment provide new context for the types of connections CalFresh adults have with the labor market in good economic times. The evidence highlights the need for policymakers and program administrators to be attentive to opportunities to further align CalFresh with the needs of those who are working. In a forthcoming report, we plan to provide new evidence on income instability among CalFresh adults.