
Asian American and Pacific Islander (AAPI) Heritage month has been commemorated across the country this May—but perhaps there is no better state to acknowledge this heritage than California, home to one in three AAPI residents of the United States. As we celebrate California’s AAPI community, let’s consider its diverse and growing population.
AAPI residents make up 15.5% of California’s total population, according to the latest census. The AAPI population increased 25% from 2010—the largest percent increase of any major racial or ethnic group in the state. The growth has been highest in the San Francisco Bay Area, where in some neighborhoods the AAPI population share increased 25 points or more.
Much of this recent growth in population share has occurred through international immigration. Over half of California’s recent immigrants now come from Asia—with just 24% from Latin America, the main source of decades past. By contrast, those who move from other states are not disproportionately members of the AAPI community. Nor are young Californians—in fact, California’s children are slightly less likely than its adults to be AAPI.
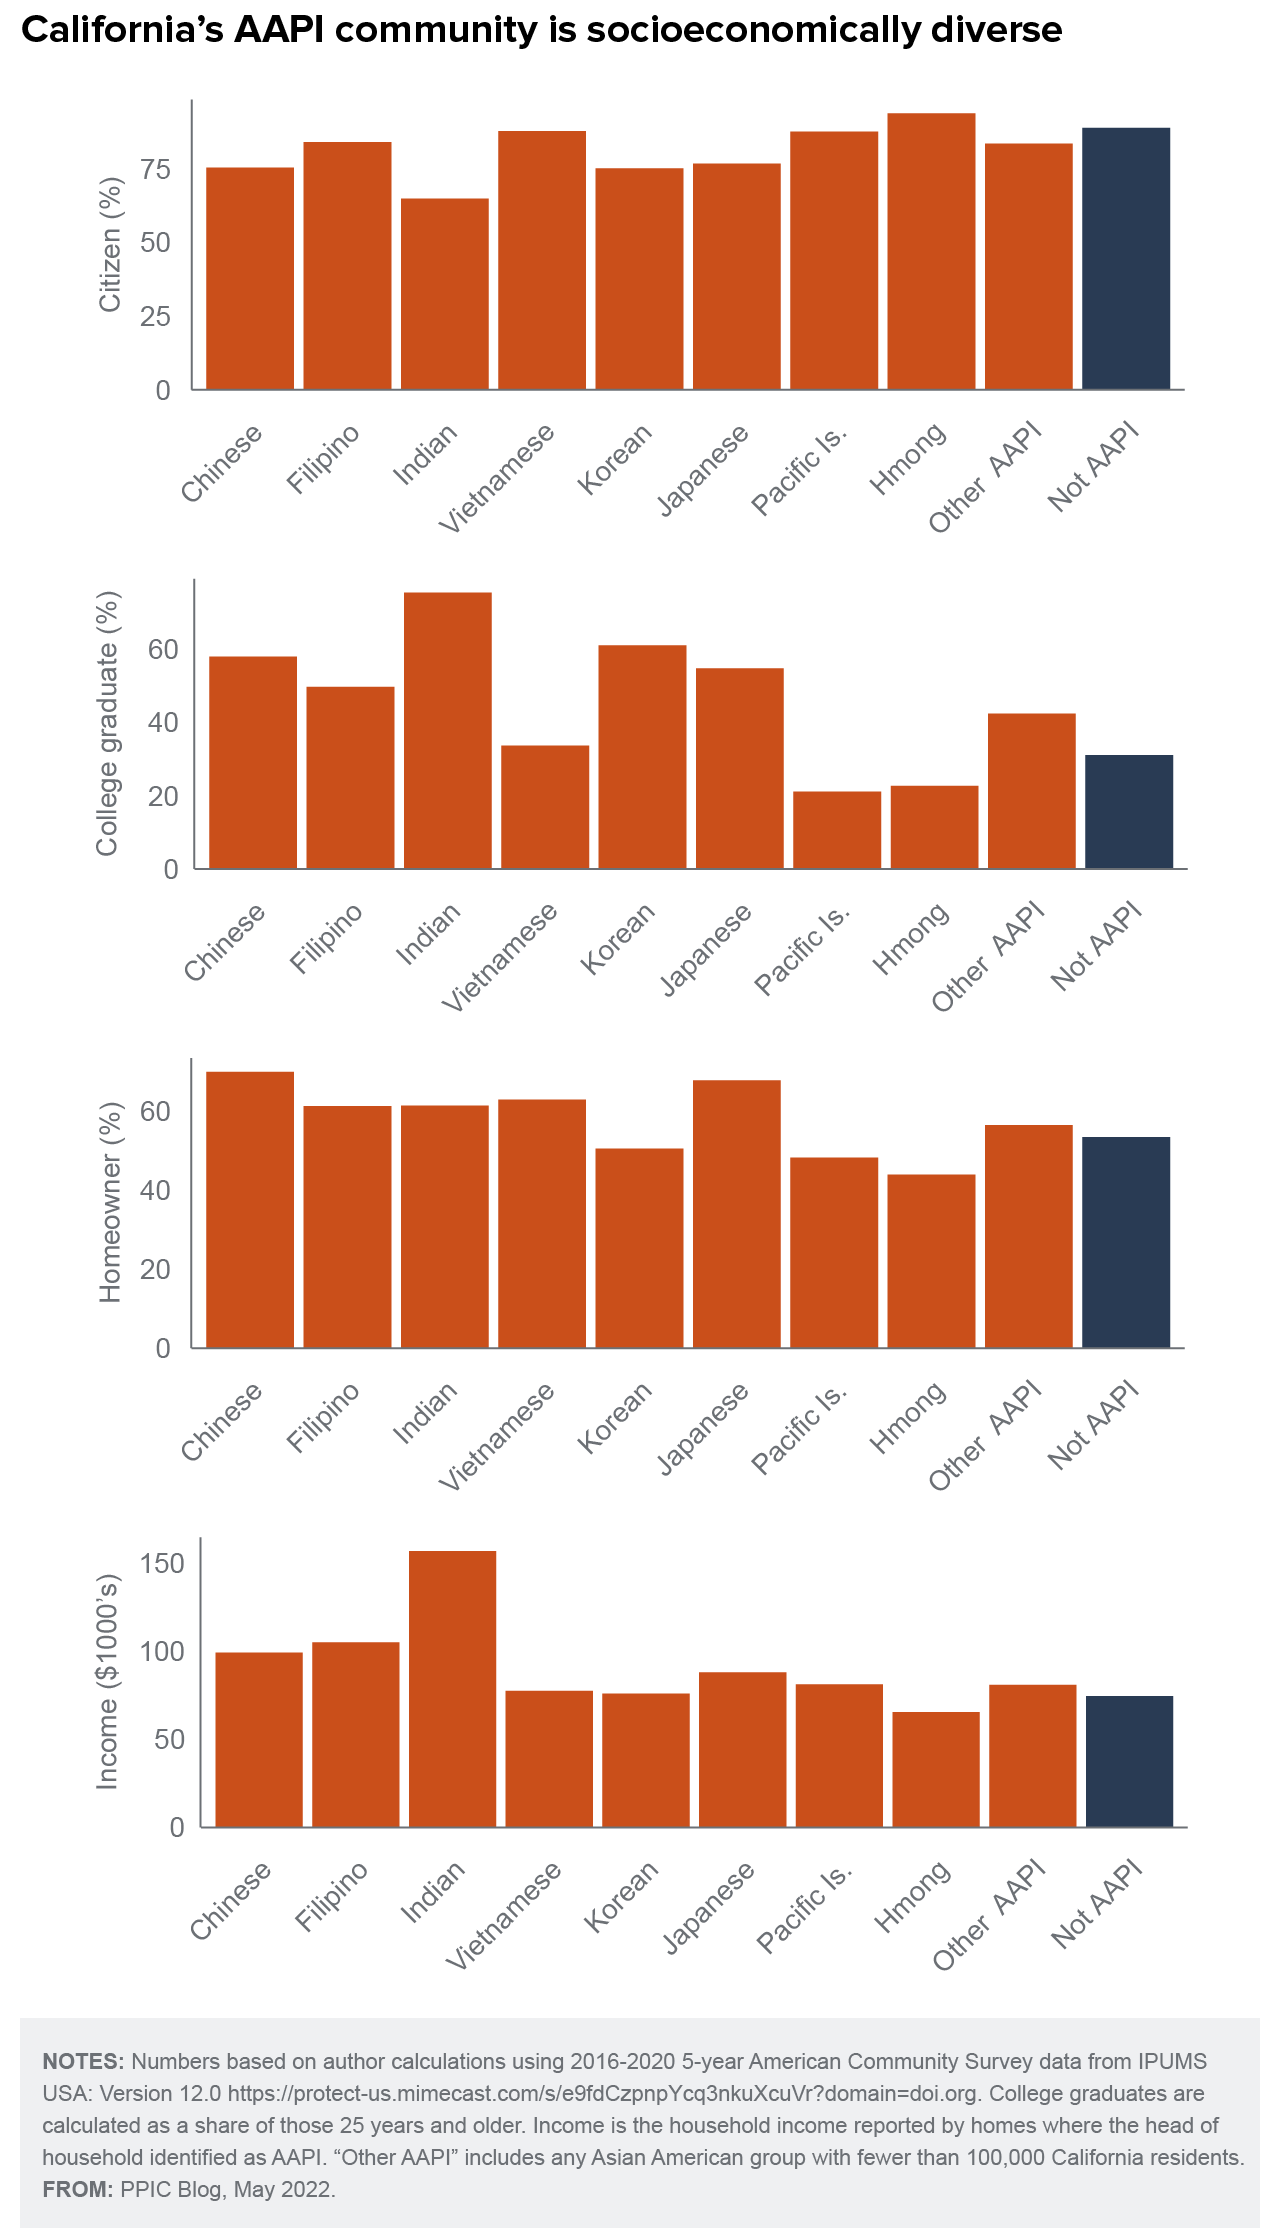
Taken as a whole, California’s AAPI community is better educated and wealthier than any other major racial or ethnic group. Just over half (53%) of AAPI Californians have a bachelor’s or graduate degree, compared to less than a third (31%) of all other Californians. The AAPI homeownership rate (62%) is second only to non-Hispanic whites (64%), and median household income among AAPI residents ($100,000) is far above the median of other Californians ($75,000) or any individual racial or ethnic group.
However, it is impossible to speak of a monolithic AAPI community. Asian Indian Californians have by far the highest incomes ($157,000) of any AAPI group, followed by Filipino ($105,000) and Chinese ($99,000) Californians. The lowest incomes are found among Vietnamese ($78,000), Korean ($76,000), and Hmong ($65,000) Californians, with numbers at or below the state median. Patterns of homeownership mostly map onto these income differences, though Vietnamese Californians are more likely to own a home (63%) than their incomes might suggest.
These incomes map less well onto education and citizenship rates. Indians are the most likely to have a college degree (75%) but the least likely to be citizens (65%), while Hmong Californians are one of the least likely to have a college degree (23%) but are the most likely to be citizens (94%). And virtually every combination can be found in between.
California’s AAPI residents may share a common ancestry from a broad region of the world, but can be as different from each other as from the state’s non-AAPI residents. This diverse community is an increasingly important part of the state’s immigrant story and will play a key role in shaping California’s future.